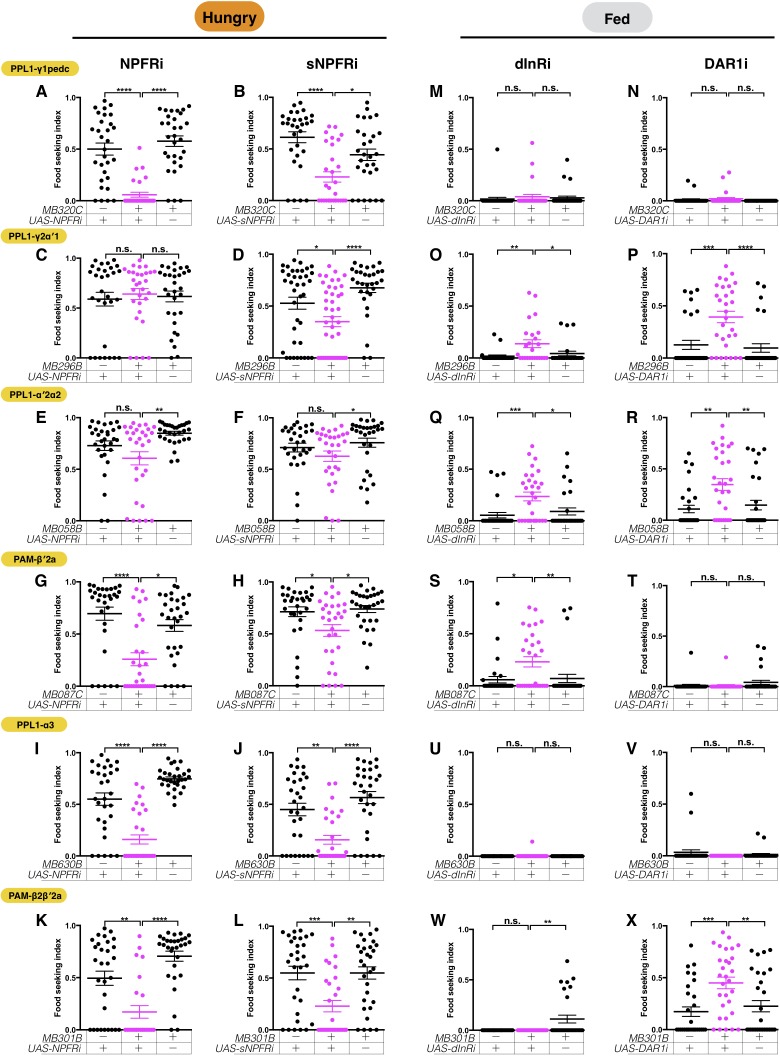
Figure 11. The six assessed DANs are regulated by combinations of hunger and satiety signals.
The yeast food-seeking performance of 24-hr-starved (A–L) and food-satiated (M–X) male flies was assessed. (A) The performance of MB320C;UAS-NPFR-RNAi flies was impaired (PPL1-γ1pedc, Kruskal-Wallis, n = 30, p<0.0001). (B) The performance of MB320C;UAS-sNPFR-RNAi flies was impaired (PPL1-γ1pedc, Kruskal-Wallis, n = 29–30, p=0.0438). (C) The performance of MB296B;UAS-NPFR-RNAi flies was normal (PPL1-γ2α′1, Kruskal-Wallis, n = 30, p>0.9999). (D) The performance of MB296B;UAS-sNPFR-RNAi flies was impaired (PPL1-γ2α′1, Kruskal-Wallis, n = 30–44, p=0.0145). (E) The performance of MB058B;UAS-NPFR-RNAi flies was normal (PPL1-α′2α2, n = 30, p>0.9999). (F) The performance of MB058B;UAS-sNPFR-RNAi flies was normal (PPL1-α′2α2, Kruskal-Wallis, n = 30, p=0.4948). (G) The performance of MB087C;UAS-NPFR-RNAi flies was impaired (PAM-β′2a, Kruskal-Wallis, n = 30, p=0.0155). (H) The performance of MB087C;UAS-sNPFR-RNAi flies was impaired (PAM-β′2a, Kruskal-Wallis, n = 30, p=0.0162). (I) The performance of MB630B;UAS-NPFR-RNAi flies was impaired (PPL1-α3, Kruskal-Wallis, n = 30, p<0.0001). (J) The performance of MB630B;UAS-sNPFR-RNAi flies was impaired (PPL1-α3, Kruskal-Wallis, n = 30, p=0.0038). (K) The performance of MB301B;UAS-NPFR-RNAi flies was impaired (PAM-β2β′2a, Kruskal-Wallis, n = 25–30, p=0.0087). (L) The performance of MB301B;UAS-sNPFR-RNAi flies was impaired (PAM-β2β′2a, Kruskal-Wallis, n = 30, p=0.0013). (M) The performance of MB320C;UAS-dInR-RNAi flies was normal (PPL1-γ1pedc, Kruskal-Wallis, n = 30, p>0.9999). (N) The performance of MB320C0;UAS-DAR1-RNAi flies was normal (PPL1-γ1pedc, Kruskal-Wallis, n = 30, p>0.9999). (O) The performance of MB296B;UAS-dInR-RNAi flies was enhanced (PPL1-γ2α′1, Kruskal-Wallis, n = 24–25, p=0.0199). (P) The performance of MB296B;UAS-DAR1-RNAi flies was enhanced (PPL1-γ2α′1, Kruskal-Wallis, n = 30, p=0.0002). (Q) The performance of MB058B;UAS-dInR-RNAi flies was enhanced (PPL1-α′2α2, Kruskal-Wallis, n = 29–30, p=0.0126). (R) The performance of MB058B;UAS-DAR1-RNAi flies was enhanced (PPL1-α′2α2, Kruskal-Wallis, n = 30, p=0.009). (S) The performance of MB087C;UAS-dInR-RNAi flies was enhanced (PAM-β′2a, Kruskal-Wallis, n = 30, p=0.0192). (T) The performance of MB087C;UAS-DAR1-RNAi flies was normal (PAM-β′2a, Kruskal-Wallis, n = 30, p=0.3645). (U) The performance of MB630B;UAS-dInR-RNAi flies was normal (PPL1-α3, Kruskal-Wallis, n = 30, p=0.6620). (V) The performance of MB630B;UAS-DAR1-RNAi flies was normal (PPL1-α3, Kruskal-Wallis, n = 30, p=0.6699). (W) The performance of MB301B;UAS-dInR-RNAi flies was normal (PAM-β2β′2a, Kruskal-Wallis, n = 25–30, p>0.9999). (X) The performance of MB301B;UAS-DAR1-RNAi flies was enhanced (PAM-β2β′2a, Kruskal-Wallis, n = 30, p=0.0071). Individual data points and mean ± SEM are shown.


