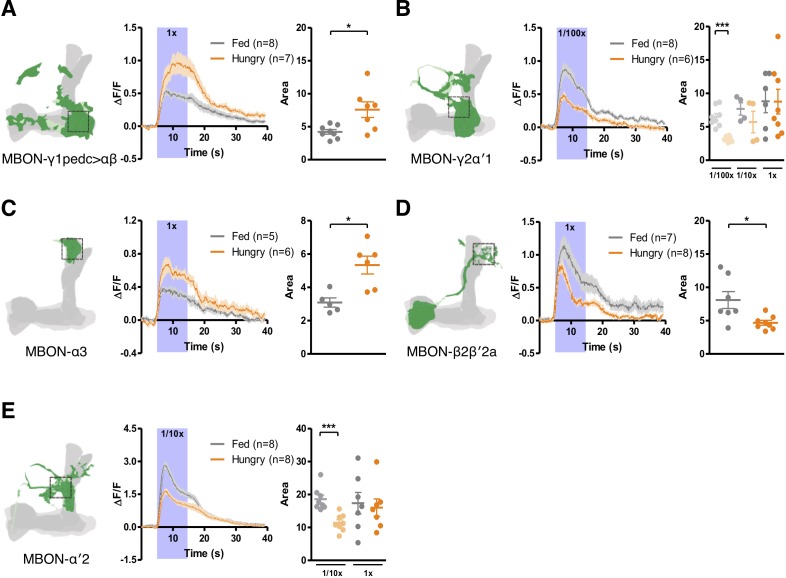
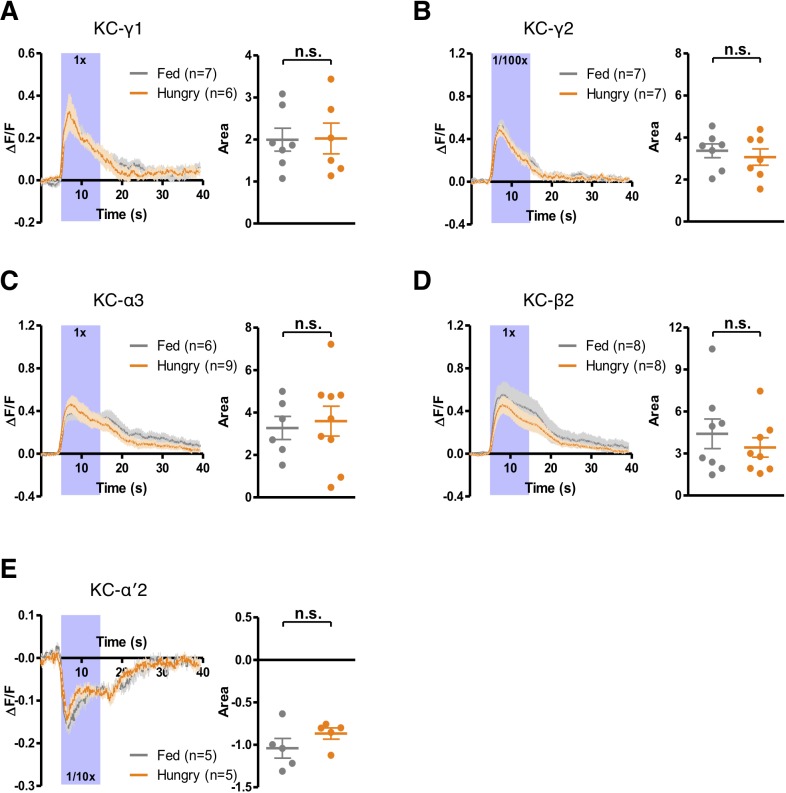
Figure 5. Starvation bi-directionally modulates the responses of MBONs to yeast odor.
Hunger increases (A and C) and decreases (B, D and E) yeast odor-evoked calcium transients (visualized using GCaM6m) in (A) MBON-γ1pedc>αβ (with MB112C-splitGAL4), (B) MBON-γ2α′1 (with MB077B-splitGAL4), (C) MBON-α3 (with G0239-GAL4), (D) MBON-β2β′2a (with MB399B-splitGAL4), and (E) MBON-α′2 (with MB091C-splitGAL4). Schematics indicate where the Ca2+ response was measured. Ca2+ imaging data are mean (solid line) ± SEM (shaded area) normalized curves (see Materials and methods). Wide purple bars indicate the 10 s when yeast odor was presented. Dot plots are quantifications of the area under the curve during the 10 s odor presentation. Individual data points and mean ± SEM are shown. Yeast odor was also tested at 1/10x dilution in (B) and (E) and at 1/100x dilution in (B). Asterisks denote statistical significance; Mann-Whitney test; (A) p=0.0289, (B) p=0.0007, (C) p=0.0173, (D) p=0.0289, (E) p=0.0003.


