. 2018 Mar 16;7:e35264. doi: 10.7554/eLife.35264

Figure 6. GABAergic MBON-γ1pedc>αβ promotes yeast food-seeking behavior by inhibiting β′2-innervating MBONs and MBON-α1.

Male flies starved for 24 hr (A, B and D) or food-satiated (C and E) were assessed for their yeast food-seeking performance. Individual data points and mean ± SEM are shown. (A) The performance of MB112C;UAS-GAD-RNAi flies was statistically lower than the controls (Kruskal-Wallis, n = 30, p<0.0001). (B) The performance of VT1211-GAL4;UAS-Rdl-RNAi flies was significantly lower than the controls (Kruskal-Wallis, n = 30, p=0.0053). (C) The performance of VT1211-GAL4;UAS-shits1 flies was statistically higher than the controls at a restrictive 32°C (Kruskal-Wallis, n = 30, p=0.0015). (D) The performance of MB310C;UAS-Rdl-RNAi flies was statistically lower than the controls (Kruskal-Wallis, n = 28–30, p=0.0004). (E) The performance of MB310C;UAS-shits1 flies was higher than the controls at a restrictive 32°C (Kruskal-Wallis, n = 30, p<0.0021). (F) A model showing the relationship between MBON-γ1pedc>αβ, MBON-γ5β′2a, MBON-β′2mp, and MBON-α1.

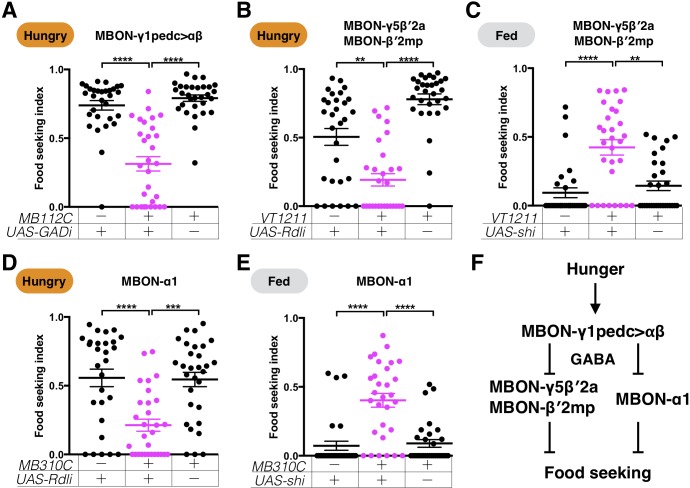
Figure 6.

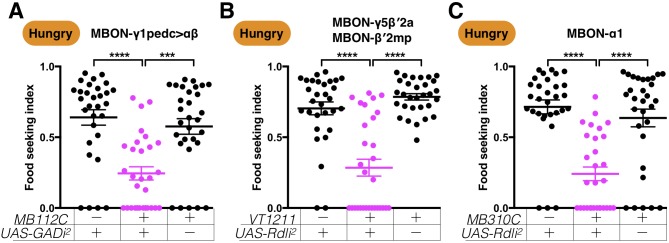
Figure 6—figure supplement 1. A second set of RNAi lines confirms that GABAergic MBON-γ1pedc>αβ promotes yeast food-seeking behavior by inhibiting β′2-innervating MBONs and MBON-α1.

Figure 6—figure supplement 1.

Male flies starved for 24 hr were assessed for their yeast food-seeking performance. (A) The performance of MB112C;UAS-GAD-RNAi2 flies was statistically lower than the controls (Kruskal-Wallis, n = 30, p=0.0001). (B) The performance of VT1211-GAL4;UAS-Rdl-RNAi2 flies was significantly lower than the controls (Kruskal-Wallis, n = 30, p<0.0001). (C) The performance of MB310C;UAS-Rdl-RNAi2 flies was statistically lower than the controls (Kruskal-Wallis, n = 30, p<0.0001). Individual data points and mean ± SEM are shown.
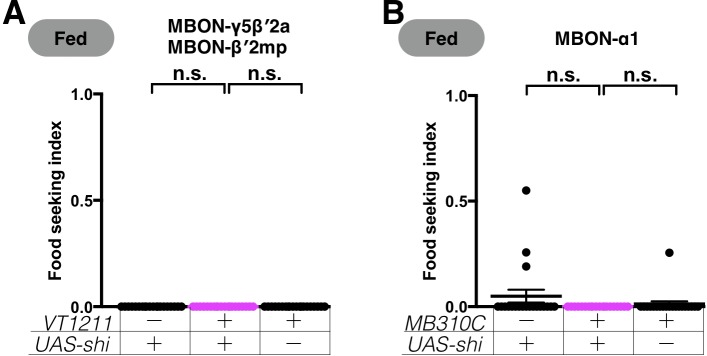
Figure 6—figure supplement 2. Expression of UAS-shits1 in the MBONs does not affect yeast food-seeking performance at the permissive temperature.

Figure 6—figure supplement 2.

(A) No statistical difference was detected between the controls and flies expressing UAS-shits1 in MBON-γ5β′2a and MBON-β′2mp (VT1211, Kruskal-Wallis, n = 20, p>0.9999). (B) No statistical difference was detected between flies expressing UAS-shits1 in MBON-α1 and relevant controls (MB310C, Kruskal-Wallis, n = 20, p=0.1545). Individual data points and mean ± SEM are shown.
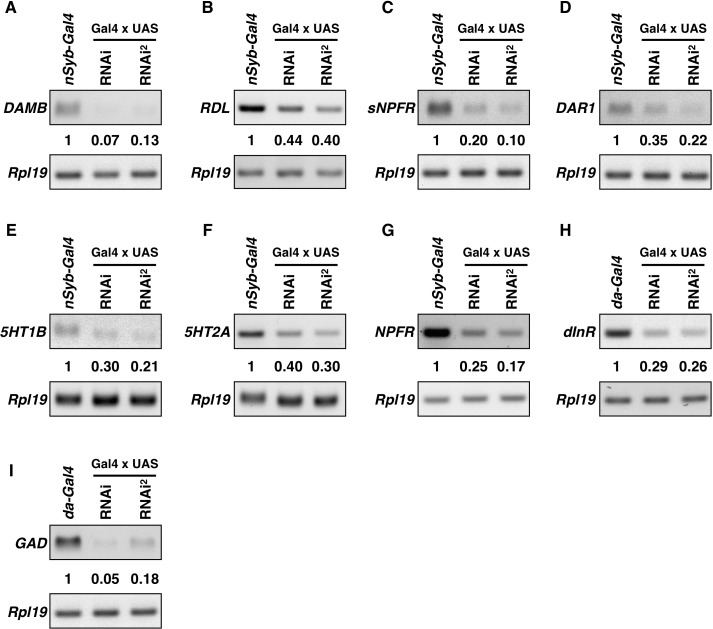
Figure 6—figure supplement 3. Knockdown efficiency of the RNAi lines.

Figure 6—figure supplement 3.

RT-PCR results for DAMB, Rdl, sNPFR, DAR1, 5HT1B, 5HT2A, NPFR, dInR, GAD, and Rpl19 are shown. Pan-neuronal nSyb-GAL4 (A–G) or da-GAL4 (H–I) were used to drive two independent RNAi lines (Key resources table). Total RNA was extracted from adult brains (A–G), or—because flies with knockdown of dInR and GAD using nSyb-GAL4 failed to survive to adulthood—third-instar larvae (H–I). Rpl19 was used as an internal control. Intensity of the PCR bands was normalized to Rpl19, and the quantification of intensities relative to the nSyb-GAL4-only controls are shown.