. 2018 Mar 16;7:e35264. doi: 10.7554/eLife.35264

Figure 7. DANs mediate hunger-control of yeast food-seeking behavior.

(A–E) Male flies starved for 24 hr were assessed for their yeast food-seeking performance. At a restrictive 32°C, the performance was significantly different between the controls and flies expressing UAS-shits1 in (A) PPL1-γ2α′1 (MB296B, Kruskal-Wallis, n = 30, p=0.0018), (B) PPL1-α′2α2 (MB058B, Kruskal-Wallis, n = 30, p=0.0012), (C) PAM-β′2a (MB087C, Kruskal-Wallis, n = 30, p=0.0002), (D) PAM-β2β′2a (MB301B, Kruskal-Wallis, n = 30, p=0.0001), and (E) PPL1-α3 (MB630B, Kruskal-Wallis, n = 30, p=0.0023) DANs. (F) The performance of MB320C;UAS-TrpA1 male flies starved for 24 hr was lower than the controls (PPL1-γ1pedc, Kruskal-Wallis, n = 30, p=0.003). (G) The performance of male MB320C;UAS- shits1 fed flies was statistically better than the controls (PPL1-γ1pedc, Kruskal-Wallis, n = 30, p=0.001). (H–L) Food-satiated male flies were tested for their yeast food-seeking performance. At 32°C, the performance was statistically different between the controls and flies expressing UAS-TrpA1 in (H) PPL1-γ2α′1 (MB296B, Kruskal-Wallis, n = 30, p<0.0001), (I) PPL1-α′2α2 (MB058B, n = 30, p=0.0004), (J) PAM-β′2a (MB087C, Kruskal-Wallis, n = 30, p=0.0056), (K) PAM-β2β′2a (MB301B, Kruskal-Wallis, n = 30, p<0.0001), and (L) PPL1-α3 (MB630B, Kruskal-Wallis, n = 30, p=0.0049) DANs. Individual data points and mean ± SEM are shown. The brain images in (A–F) are full z-projections of confocal stacks showing the expression patterns of the GAL4 lines (green) counter-stained with nc82 antibody (magenta). One side of the MB is outlined by a white dashed line. Scale bars are 100 µm.

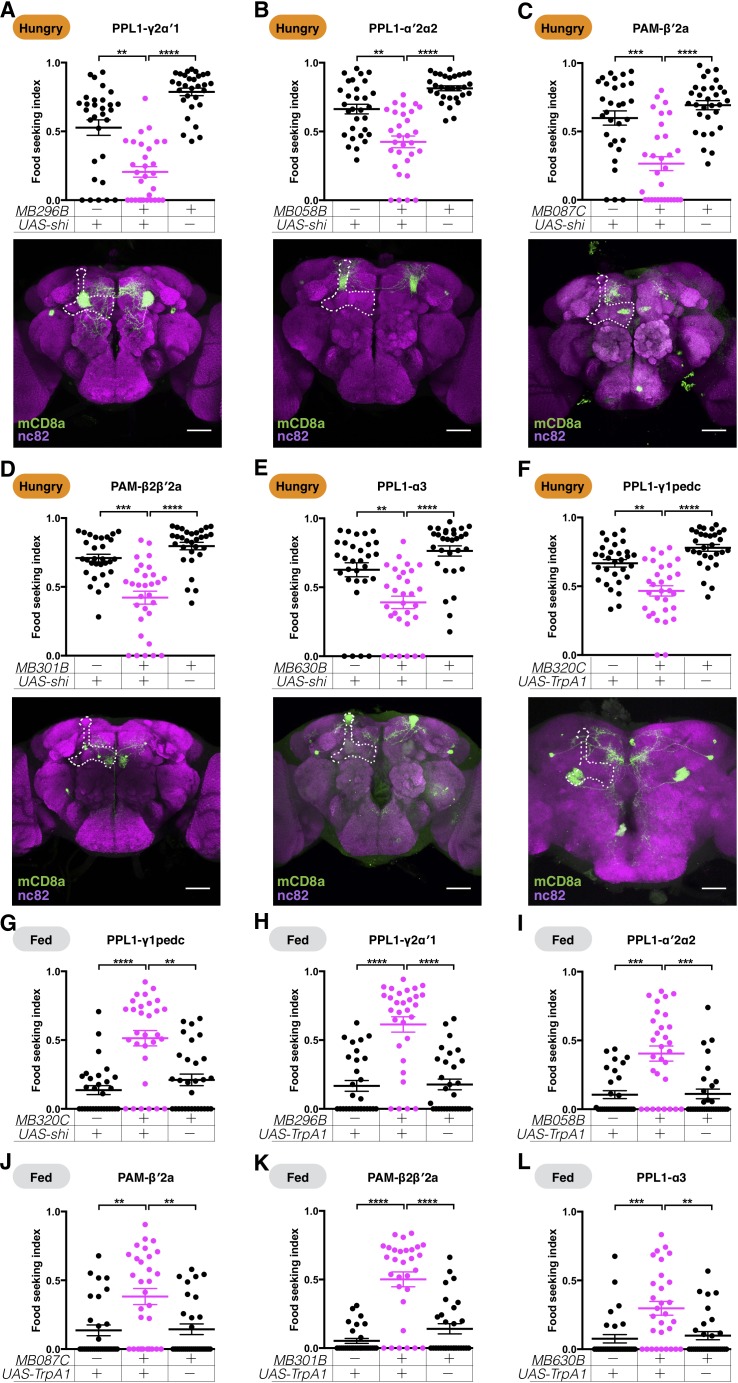
Figure 7.

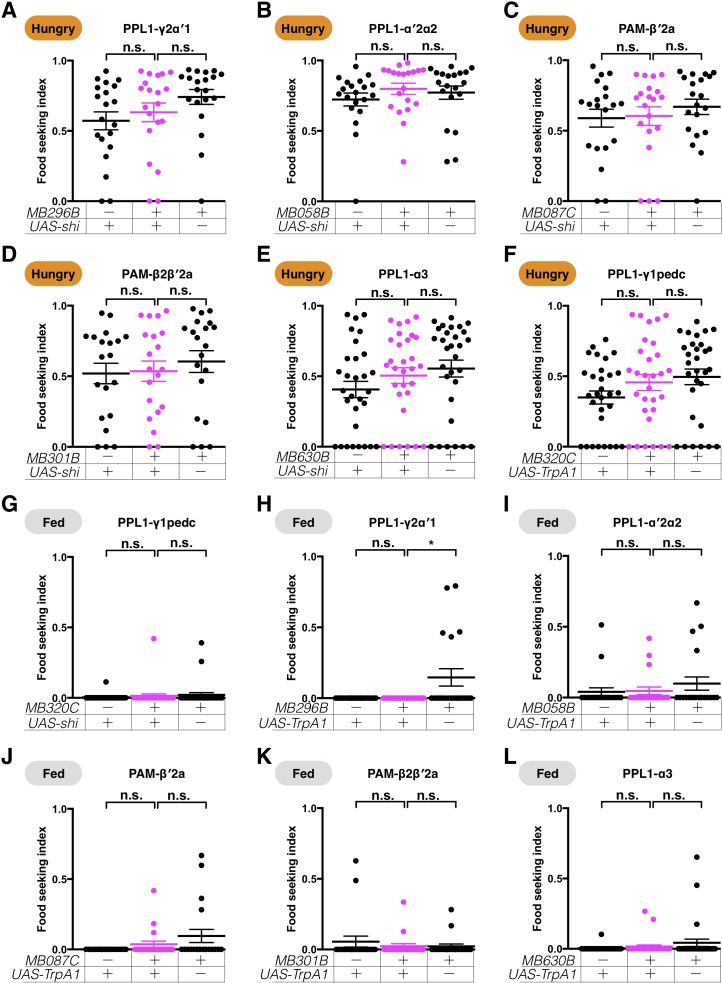
Figure 7—figure supplement 1. Expression of UAS-shits1 or UAS-TrpA1 in the DANs does not affect yeast food-seeking performance at the permissive temperature.

Figure 7—figure supplement 1.

No statistical difference was detected between the controls and flies expressing UAS-shits1 in (A) PPL1-γ2α′1 (MB296B, Kruskal-Wallis, n = 20, p=0.0737), (B) PPL1-α′2α2 (MB058B, Kruskal-Wallis, n = 20, p=0.1662), (C) PAM-β′2a (MB087C, Kruskal-Wallis, n = 20, p=0.6230), (D) PAM-β2β′2a (301B, Kruskal-Wallis, n = 20, p=0.5019), and (E) PPL1-α3 (MB630B, Kruskal-Wallis, n = 30, p=0.1456) DANs. (F) No statistical difference was detected between flies expressing UAS-TrpA1 in PPL1-γ1pedc DANs and relevant controls (MB320C, Kruskal-Wallis, n = 30, p=0.0794). (G) No statistical difference was detected between flies expressing UAS-shits1 in PPL1-γ1pedc DANs and relevant controls (MB320C, Kruskal-Wallis, n = 30, p=0.7715). No statistical difference was detected between the controls and flies expressing UAS-TrpA1 in (H) PPL1-γ2α′1 (MB296B, Kruskal-Wallis, n = 20, p=0.6225), (I) PPL1-α′2α2 (MB058B, Kruskal-Wallis, n = 20, p=0.199), (J) PAM-β′2a (MB087C, Kruskal-Wallis, n = 20, p=0.9928), (K) PAM-β2β′2a (301B, Kruskal-Wallis, n = 20, p=0.4434), and (L) PPL1-α3 (MB630B, Kruskal-Wallis, n = 30, p=0.5547) DANs. Satiety states (fed or hungry) are indicated in each figure. Individual data points and mean ± SEM are shown.
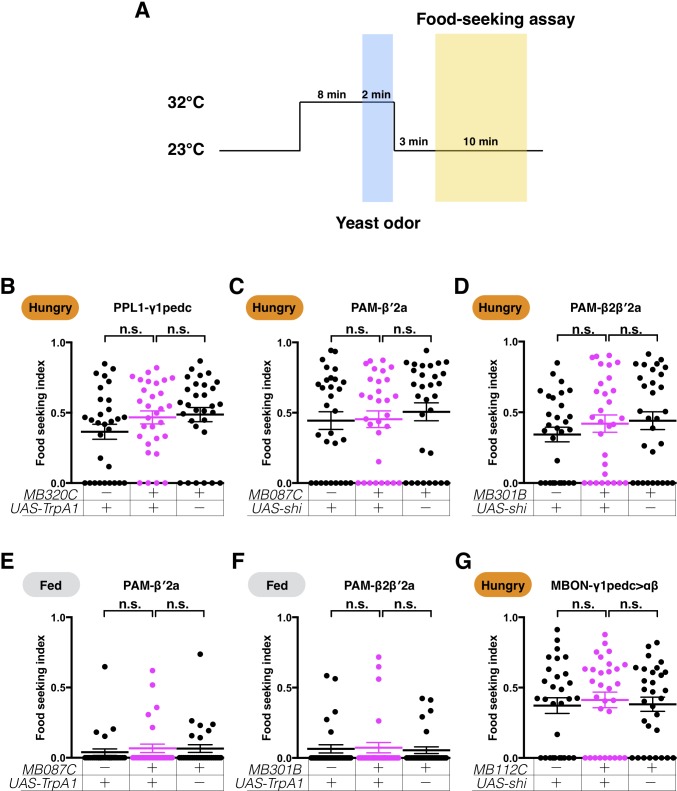
Figure 7—figure supplement 2. Pre-conditioning flies by pairing yeast odor with the activation or silencing of DANs and MBONs does not affect their yeast food-seeking performance.

Figure 7—figure supplement 2.

(A) A schematic of the behavioral protocol. (B–G) Under this protocol, no difference in yeast food-seeking performance was detected between the controls and (B) MB320C;UAS-TrpA1 (PPL1-γ1pedc, Kruskal-Wallis, n = 30, p=0.1979), (C) MB087C;UAS-shits1 (PAM-β′2a, Kruskal-Wallis, n = 30, p=0.612), (D) MB301B;UAS-shits1 (PAM-β2β′2a, Kruskal-Wallis, n = 30, p=0.375), (E) MB087C;UAS-TrpA1 (PAM-β′2a, Kruskal-Wallis, n = 30, p=0.6082), (F) MB301B;UAS-TrpA1 (PAM-β2β′2a, Kruskal-Wallis, n = 30, p=0.9636), and (G) MB112C;UAS-shits1 (MBON-γ1pedc>αβ, Kruskal-Wallis, n = 30, p=0.8135) flies. Satiety states (fed or hungry) are indicated in each figure. Individual data points and mean ± SEM are shown.