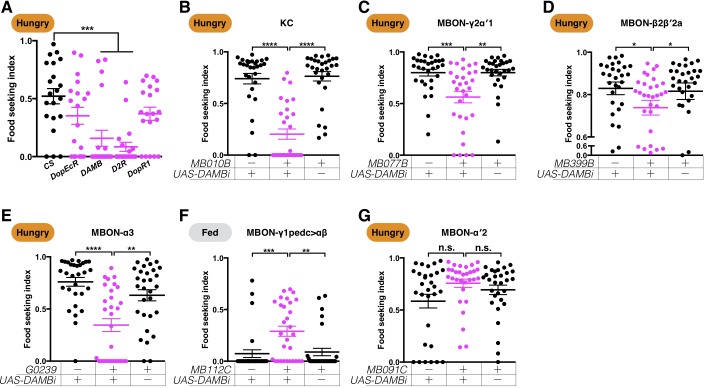
Figure 8. The dopamine receptor DAMB is required pre- and post-synaptically to regulate yeast food-seeking behavior.
(A) The yeast food-seeking performance in 24-hr-starved male wild-type flies (CS, n = 21) and flies homozygous for DopEcR (n = 19), DAMB (n = 20), D2R (n = 20), and DopR1 (n = 20) was assessed. The performance of the DAMB and D2R flies was significantly lower than for the wild-type flies (Kruskal-Wallis, p=0.0024 for DAMB; p=0.0003 for D2R). (B–G) Male flies starved for 24 hr (B–E and G) or food-satiated (F) were assessed for their yeast food-seeking performance. The performance of GAL4;UAS-DAMB-RNAi flies was statistically different from the controls for (B) MB010B (all KCs, Kruskal-Wallis, n = 29–30, p<0.0001), (C) MB077B (MBON-γ2α′1, Kruskal-Wallis, n = 30, p=0.0018), (D) MB399B (MBON-β2β′2a, Kruskal-Wallis, n = 29–30, p=0.0285), (E) G0239 (MBON-α3, Kruskal-Wallis, n = 30, p=0.007). (F) MB112C (MBON-γ1pedc>αβ, Kruskal-Wallis, n = 30, p=0.0028), but not for (G) MB091C (MBON-α′2, Kruskal-Wallis, n = 30, p=0.5757). Satiety states (fed or hungry) are indicated in each figure. Individual data points and mean ± SEM are shown.


