. 2018 Mar 16;7:e35264. doi: 10.7554/eLife.35264

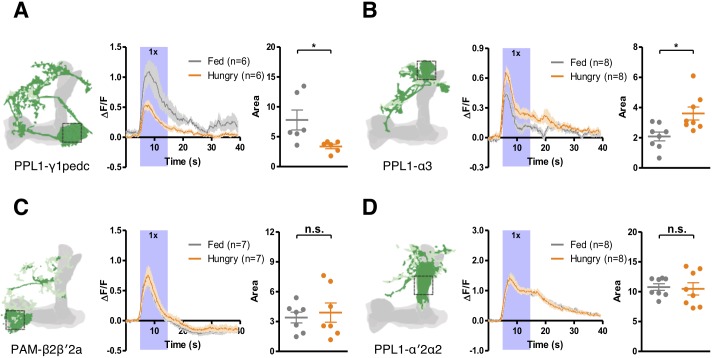
Figure 9. Starvation modulates yeast odor-evoked responses in some DANs.

GCaMP6m was expressed in PPL1-γ1pedc DANs using MB320C split-GAL4 (A), PPL1-α3 DANs using G0239-GAL4 (B), PAM-β2β′2a DANs using MB301B split-GAL4 (C), and PPL1-α′2α2 DANs using MB058B split-GAL4 (D). The Ca2+ signals were measured when flies were presented with yeast odor. Schematics indicate where the Ca2+ response was measured. Ca2+ imaging data are mean (solid line) ± SEM (shaded area) normalized curves (see Materials and methods). Wide purple bars indicate the 10 s when yeast odor was presented. Dot plots are quantifications of the area under the curve during the 10 s odor presentation. Individual data points and mean ± SEM are shown. Statistical differences were detected in (A) PPL1-γ1pedc (Mann-Whitney test, n = 6, p=0.026) and (B) PPL1-α3 (Mann-Whitney test, n = 8, p=0.014) DANs, but not in (C) PAM-β2β′2a (Mann-Whitney test, n = 7–8, p=0.7789) or (D) PPL1-α′2α2 (Mann-Whitney test, n = 8, p=0.7984) DANs.

Figure 9.

Figure 9—figure supplement 1. Starvation may increase the density or size of active zones in some DANs.

Figure 9—figure supplement 1.

Transgenes UAS-DSyd-1-GFP and UAS-DenMark were expressed in PPL1-γ2α′1 DANs using MB296B split-GAL4 (A), PAM-β2β′2a DANs using MB301B split-GAL4 (B), PPL1-α′2α2 DANs using MB058B split-GAL4 (C), PPL1-γ1pedc DANs using MB320C split-GAL4 (D), and PPL1-α3 DANs using G0239-GAL4 (E). Mean intensity of DSyd-1-GFP (green dots) was significantly different between hungry and fed flies for (A) PPL1-γ2α′1 (unpaired t-test, n = 15–16, p=0.0056), (B) PAM-β2β′2a (unpaired t-test, n = 15–16, p=0.0406), and (C) PPL1-α′2α2 (unpaired t-test, n = 16, p=0.0314) DANs, but not for (D) PPL1-γ1pedc (unpaired t-test, n = 16, p=0.6393) or (E) PPL1-α3 (unpaired t-test, n = 14–16, p=0.7481) DANs. Mean intensity of DenMark (magenta dots) did not differ between hungry and fed flies in all cases (A–E) (unpaired t-test, n = 15–16, p>0.25). Data are normalized to the mean intensities of the fed flies. Individual data points and mean ± SEM are shown.