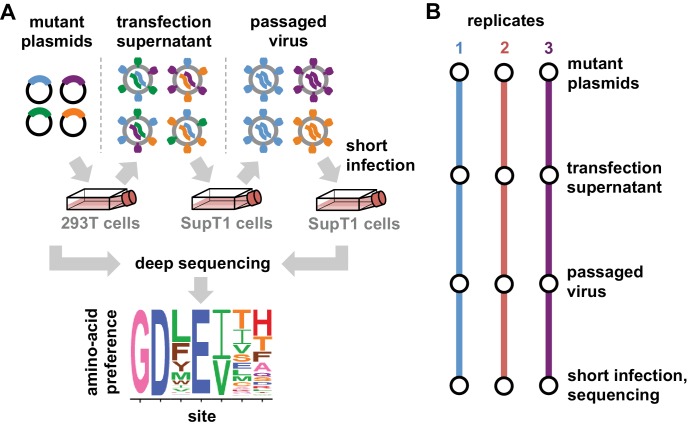
Figure 2. Deep mutational scanning workflow.
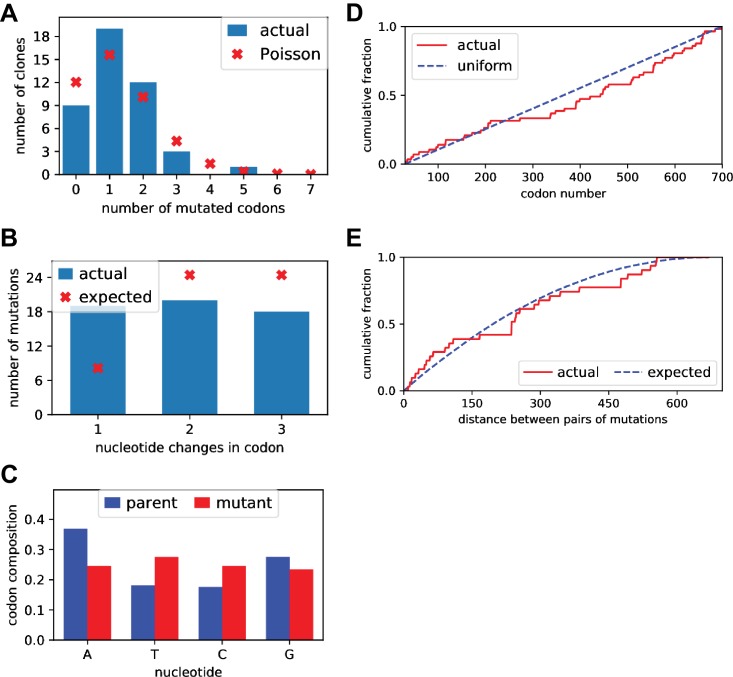
(A) We made libraries of proviral HIV plasmids with random codon-level mutations in the env gene. The number of mutations per gene approximately followed a Poisson distribution with a mean between 1 and 1.5 (Figure 2—figure supplement 1). We transfected the plasmids into 293T cells to generate mutant viruses, which lack a genotype-phenotype link since cells are multiply transfected. To establish a genotype-phenotype link and select for Env variants that support HIV growth, we passaged the libraries in SupT1.CCR5 cells for four days at a low multiplicity of infection (MOI) of 0.01. To isolate the env genes from only viruses that encoded a functional Env protein, we infected the passaged libraries into SupT1.CCR5 cells at high MOI and harvested reverse-transcribed non-integrated viral DNA after 12 hr. We then deep sequenced the env genes from these final samples as well as the initial plasmid library, using molecular barcoding to reduce sequencing errors. We also deep sequenced identically handled wildtype controls to estimate error rates. Using these sequencing data, we estimated the preference for each of the 20 amino acids at each site in Env. These data are represented in logo plots, with the height of each letter proportional to that site’s preference for that amino acid. (B) We conducted this experiment in full biological triplicate for both BG505 and BF520, beginning each replicate with independent creation of the plasmid mutant library. These replicates therefore account for all sources of noise and error in the experiments.


