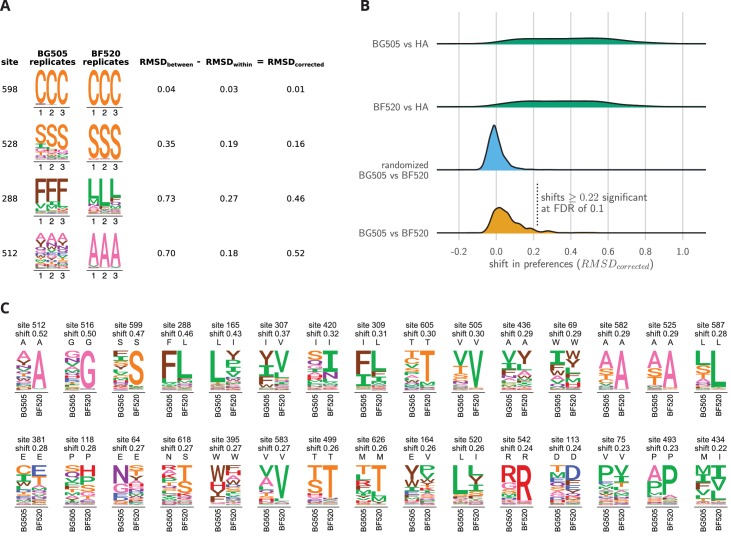
Figure 6. Env sites with shifted amino acid preferences between BG505 and BF520.
Note that the preferences have been re-scaled using the stringency parameters in Table 1 to enable direct comparison across Envs. (A) Calculation of the corrected distance between the amino acid preferences of BG505 and BF520 at four example sites. We have triplicate measurements for each Env. We calculate the distance between each pair of replicate measurements, and group these into comparisons between the two Envs and within replicates for the same Env. We compute the root-mean-square distance (RMSD) for both sets of comparisons, which we denote as RMSD and RMSD. The latter quantity is a measure of experimental noise. The noise-corrected distance between Envs at a site, RMSD, is simply the distance between the two Envs minus this noise. (B) The bottom distribution (orange) shows the corrected distances between BG505 and BF520 at all alignable sites (see Figure 6— source data 1 for numerical values). The next distribution (blue) is a null generated by computing the corrected distances on all randomizations of the replicates among Envs. The top two distributions (green) compare Env to the non-homologous influenza hemagglutinin (HA) protein (Doud and Bloom, 2016) simply putting sites into correspondence based on sequence number. We compute the p-value that a site has shifted between BG505 and BF520 as the fraction of the null distribution that exceeds that shift, and identify significant shifts at a false discovery rate (FDR) of 0.1 using the method of (Benjamini and Hochberg, 1995). Using this approach, 30 of the 659 sites have significant shifts (corrected distance 0.22). (C) All sites that have significantly shifted their amino acid preferences at an FDR of 0.01. For each site, the logo stacks show the across-replicate average preferences for BG505 and BF520. The wild-type amino acid for that Env is indicated using the small black letters above each logo plot; note how the wild-type amino acid is frequently but not always the most preferred one. The sites are sorted by the magnitude of the shift.

