
FIG. 3.
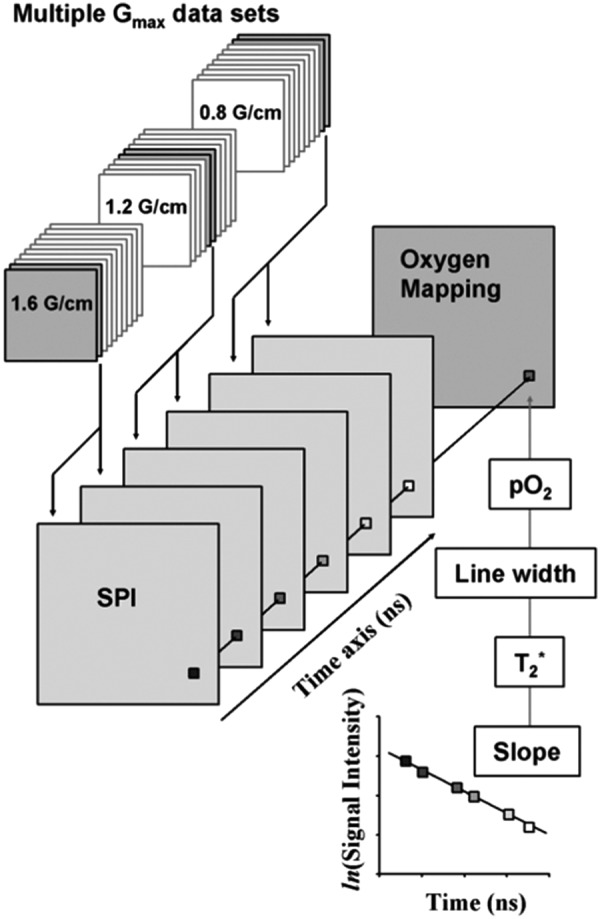
Estimation of pixelwise pO2 from SPI data sets. An SPI data set was reassembled from several SPI data sets obtained by using multiple Gmax settings. Pixels of reconstructed FID are replotted semilogarithmically. The slope of the semilogarithmical plot of the FID gives T2*. The EPR LW can be calculated from T2*. The pO2 value can be obtained from the EPR LW using a calibration curve. Finally, pO2 values are rearranged onto a matrix. EPR, electron paramagnetic resonance; pO2, partial pressure of oxygen; LW, line width. Adapted from Ref. (38) with permission.