Figure 3.
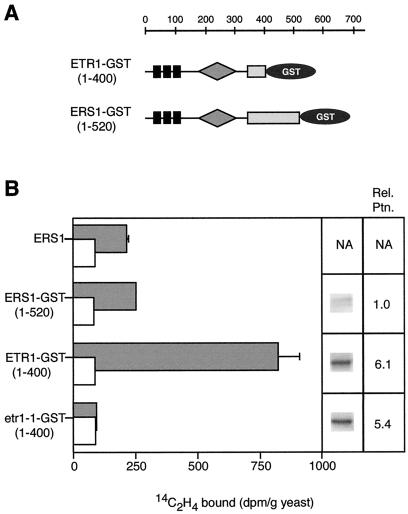
Protein expression level comparisons between ETR1-GST(1-400) and ERS1-GST(1-520). A, Domain structure of the ETR1-GST(1-400) and ERS1-GST(1-520) constructs. Black boxes represent transmembrane domains; gray triangles represent the GAF domain; light gray boxes represent the kinase domain; and dark circles represent the GST protein. B, Transgenic yeast was incubated with 0.07 μL L−1 [14C]ethylene (gray bars), or with 0.07 μL L−1 [14C]ethylene and 1,000 μL L−1 [12C]ethylene (white bars). The difference between these two values represents the saturable binding. Samples were run in triplicate and sd are shown. Yeast expressing a mutant form of the ETR1 gene (etr1-1-GST[1-400]) was used as a control. Equal amounts of yeast membranes from yeast used in the binding assays were analyzed by western blots probed with anti-GST antibodies. Protein levels were quantified by chemifluorescence imaging on a Storm system and are reported as relative levels compared with the ERS1-GST(1-520) protein level. NA, Not applicable.

