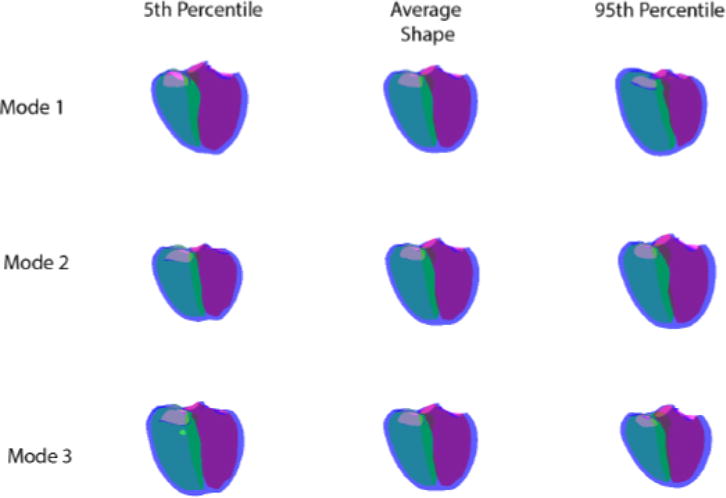
Figure 5.

The first three modes of the ED atlas. The left hand column shows the 5th percentile, the middle column the average shape and the right hand column the 95th percentile. The LV is shown in pink, the RV in green and the biventricular epicardium in blue.
