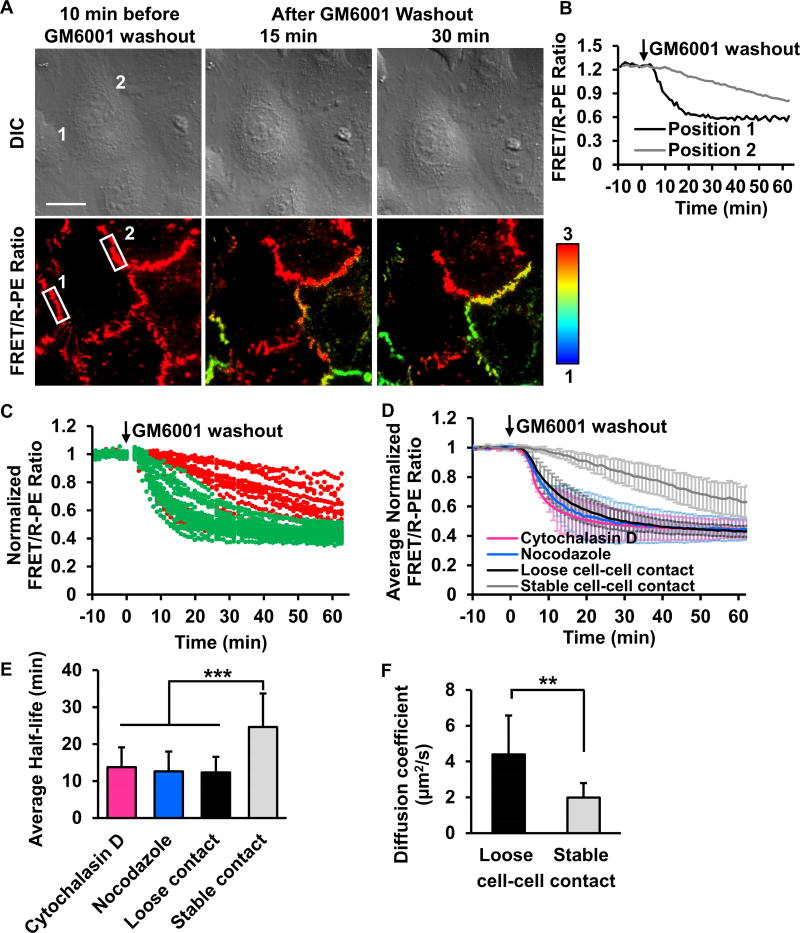
Figure 5. A distinct distribution of MT1-MMP activity at different subcellular cell-cell contacts.
(A) The representative FRET/R-PE ratio images of HeLa cells co-expressing the ECFP/PEbody MT1-MMP FRET biosensor and the full-length MT1-MMP. After GM6001 inhibitor washout, the discrete regions of the membrane showed distinctive FRET/R-PE ratios. Hot and cold colors indicate high and low ratios, respectively. The position 1 and 2 with white boxes are used to quantify the FRET/R-PE ratio in (B). Scale bar: 20 µm. (B) The quantified time course of the FRET/R-PE ratio was compared between positions 1 and 2 in (A). (C) The quantified time course of the normalized FRET/R-PE ratio from multiple cells. The normalized FRET/R-PE ratios illustrated in green or red represent results predominantly from the loose or stable cell-cell contacts, respectively. (D) The average time course of the normalized FRET/R-PE ratio quantified from the loose or stable cell-cell contacts with or without Cytochalasin D or nocodazole treatment. (E) The bar graphs represent the average half-time of signal reduction in (D) with n = 34, 30, 18, and 38, respectively, where n is the number of analyzed cell contacts. (F) The comparison of the MT1-MMP diffusion speed between free edge regions (denoted as loose cell-cell contact) and cell-cell contacts (denoted as stable cell-cell contact) (n = 7 for each group, where n is the number of cells from three independent experiments. Data in (C-D) are normalized with an individual basal FRET/R-PE ratio before GM6001 washout and data in (D-F) are represented as mean ± SD. The asterisk indicates a significant difference (**P < 0.01 and ***P < 0.001 with Wilcoxon rank sum test). See also Figures S4 and S5.

