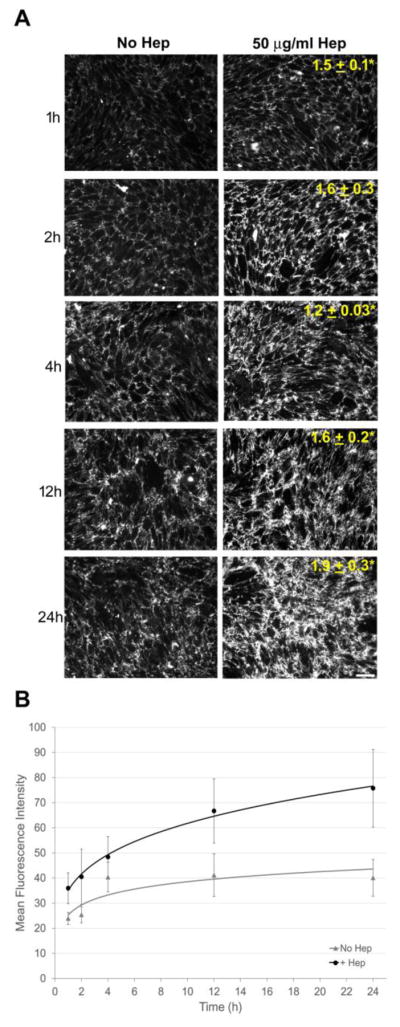
Figure 3. Heparin increases matrix at early stages of assembly.

(A) CHO-677 cells were treated as in Figure 1 and analyzed at 1, 2, 4, 12, and 24 h after addition of FN and heparin followed by immunostaining for FN and fluorescence microscopy to visualize the matrix. Mean fluorescence fold change ± SE at each time point relative to No Hep at the same time is noted on the images. Scale bar indicates 50 μm. (n = 3, *p < 0.05). (B) Plot indicates the mean fluorescence intensity ± SE as a function of time for the No Hep and + Hep conditions (n=3).
