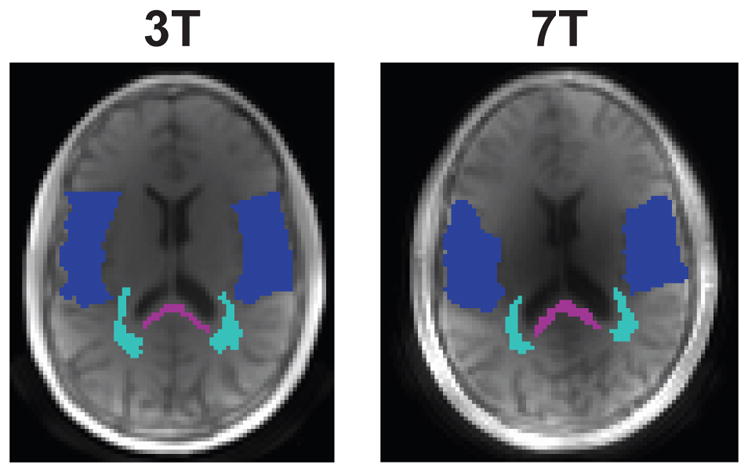
Figure 2.

ROI locations used for the the fit results in 4 and analysis in Table 1, overlaid on the shortest TE images. Purple corresponds to the posterior corpus callosum (pCC), light blue to mixed white matter (mixed WM) and dark blue to mixed gray matter (mixed GM). Note the latter ROIs are mixed, meaning they are primarily WM or GM but maybe include contributions from other tissue types including CSF.
