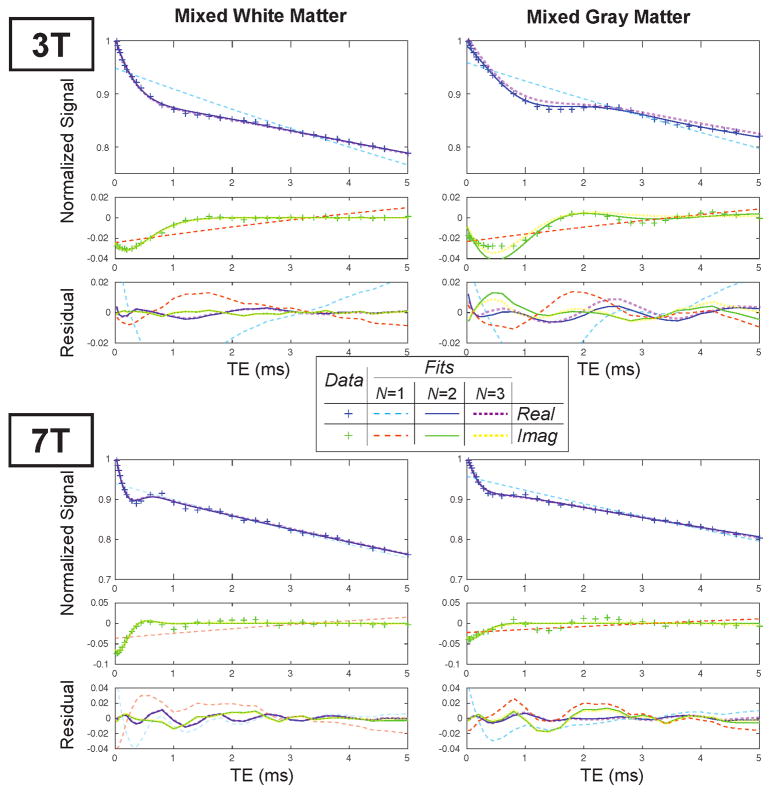
Figure 4.
Fit results at 3T and 7T for the same volunteer in several ROI locations identified in Fig. 2. The data shown was zero-order phase corrected and demodulated based on the estimated field map for these plots to illustrate the complex-valued signal oscillations. Fits to Eq. 3 with N = 1, 2, 3 components are shown as well as the fitting resiudals.

