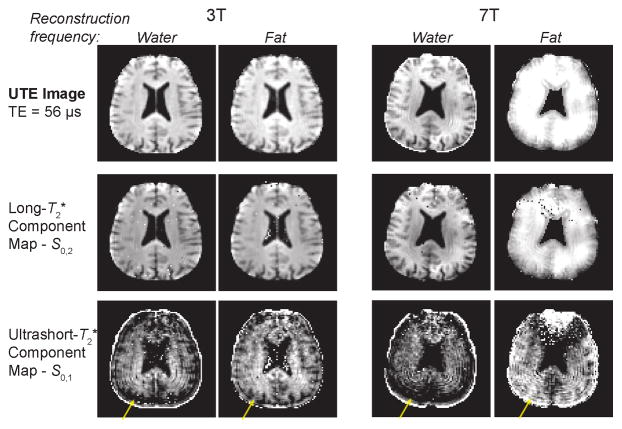
Figure 5.
Spatial characteristics of the ultrashort- and long- component maps using water- and fat-frequency reconstructions. The UTE images and long- components show more clearly defined anatomical features with a water-frequency reconstruction, while the ultrashort- component is much more clearly defined with a fat-frequency reconstruction based fitting. The yellow arrows show apparent signal loss near the skull with the water-frequency reconstructions. The spatial blurring is exacerbated at 7T compared to 3T. At 7T, the fitting of the ultrashort- component failed near the frontal sinus as shown in the top of these images.

