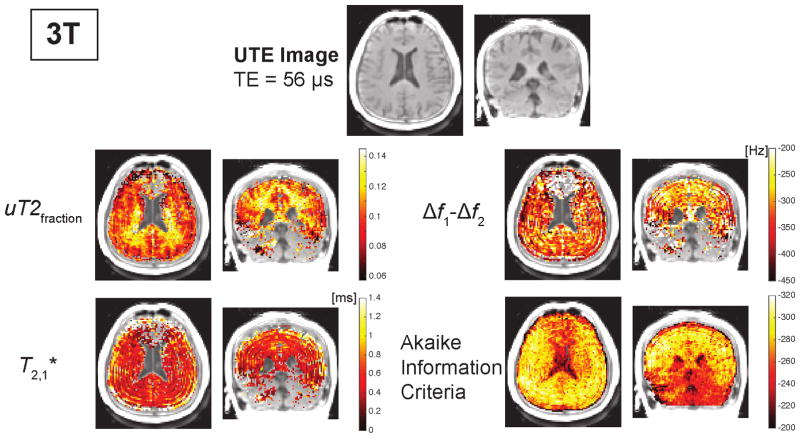
Figure 6.
Representative UTE images and parameter maps from a two-component fit at 3T. The parameter maps are only shown for regions with AIC values less than −260. The ultrashort- components were calculated based on the fat-frequency reconstruction. The ultrashort- component frequency offset, Δf1 − Δf2, includes correction for B0 inhomogeneity. The AIC maps show the fitting performed worse near the sinuses due to susceptibility shifts and in the cerebellum. Additional maps resulting from the fitting are shown in Supporting Fig. S2.

