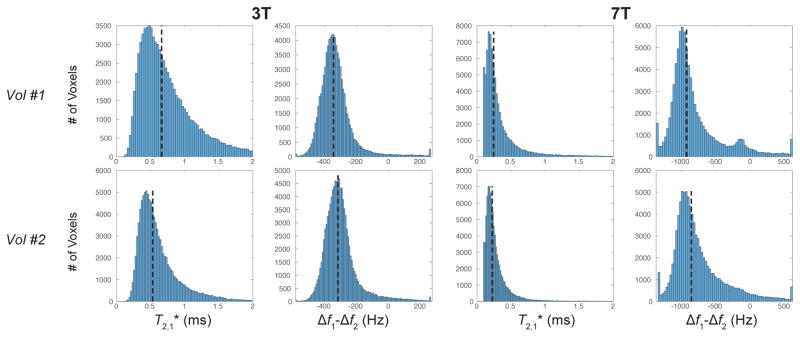
Figure 8.
Whole-brain histograms of the and frequency offset, corrected for B0 inhomogeneity, of the ultrashort- component at 3T and 7T using a two-compartment signal model. The two volunteers shown approximately represent the range of values observed, and histograms for all 5 volunteers are shown in Supporting Fig. S3. The dashed lines indicate the median values across the entire brain but excluding regions of poor fitting based on the AIC with the same criteria as in Figs. 6 and 7.

