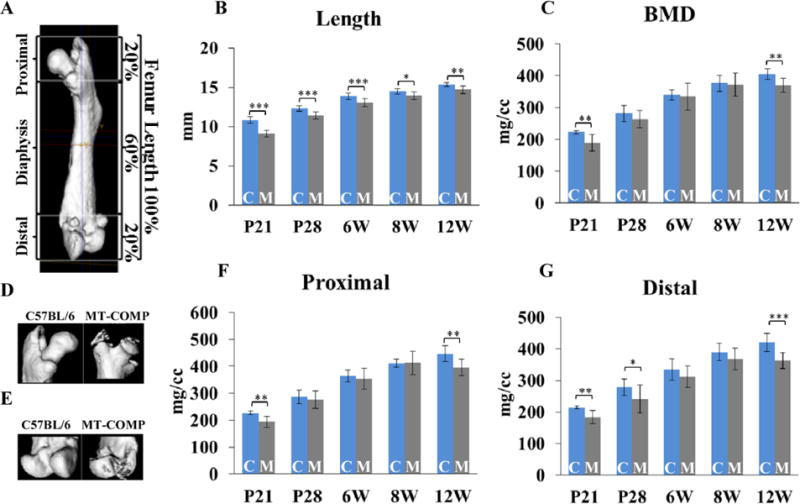
Figure 1. MT-COMP femurs are shorter and have a reduced bone mineral density.

A. Schematic showing measurements performed on the femurs at P21, P28, 6, 8 and 12 weeks. The proximal and distal ends represent 20% of the total femoral length at all ages. B. Total femoral lengths at P21, P28, 6, 8 and 12 weeks. C. Bone mineral density (BMD) from femurs from P21 to 12 weeks. D. Proximal and E. distal ends of C57BL\6 control and MT-COMP femurs reconstructed from μCT. F. BMD of proximal and G. distal ends of C57BL\6 control and MT-COMP femurs. Blue bars = C57BL\6 control and gray bars = MT-COMP; *P < 0.05; **P < 0.01; ***P < 0.001.
