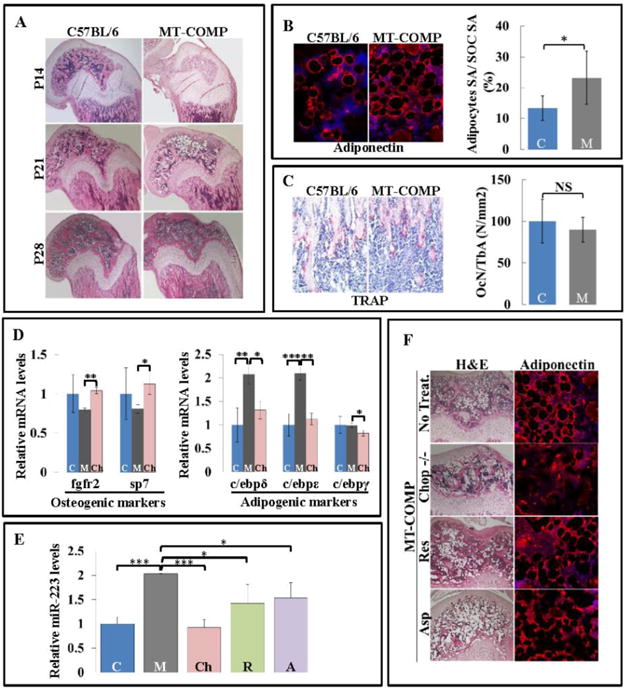
Figure 4. Increased miR-223 alters the balance of adipogenesis and osteogenesis in MT-COMP femurs.

A. Distal end of femurs from C57BL/6 and MT-COMP stained with H&E at P14, P21 and P28. B. Adiponectin immunostaining and quantification of adipocytes surface area relative to the SOC surface area at P21. C. TRAP staining (red) counterstained with hematoxylin (blue) to detect osteoclasts in the secondary spongiosa and quantification in C57BL\6 control and MT-COMP mice at P21. D. C57BL/6 control, MT-COMP and Chop−/−/MT-COMP mice mRNA level of Fgfr2 and Sp7, both osteogenic markers, at P28 and C/ebp δ, C/ebp ε, and C/ebp γ, adipogenesis markers at P21. E. miR-223 levels in P21 C57BL/6 control, MT-COMP, Chop−/−/MT-COMP and MT-COMP mice treated with resveratrol or aspirin. F. H&E and adiponectin immunostaining of C57BL\6 control, MT-COMP, Chop−/−/MT-COMP and MT-COMP treated with resveratrol or aspirin SOCs at P21. Blue bars = C57BL\6 control (C); dark gray bars = MT-COMP (M); pink bars = Chop−/−/MT-COMP (Ch); green bars = MT-COMP treated with resveratrol (R); purple bars = MT-COMP treated with aspirin (A); *P < 0.05; **P < 0.01; ***P < 0.001
