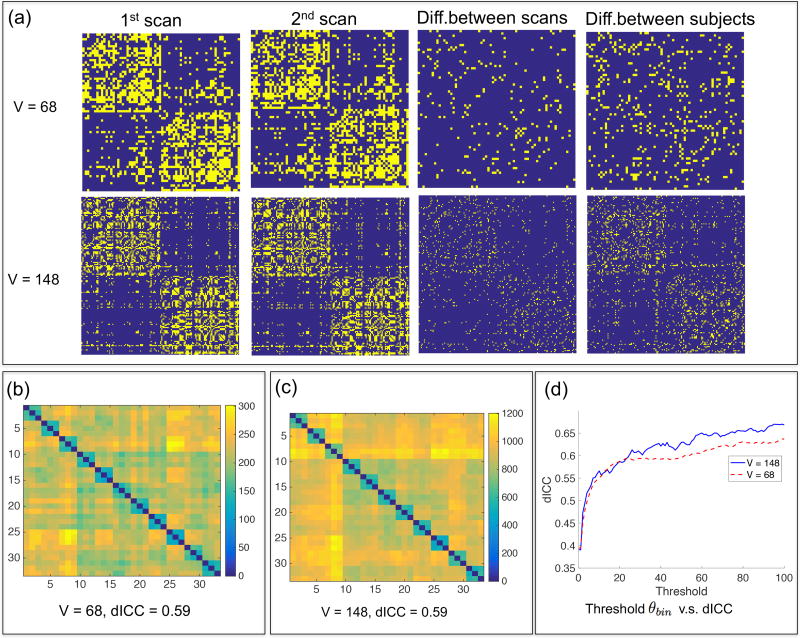
Figure 6.
Reproducibility study at the binary network level. (a) The leftmost two columns show two binary network matrices from two different scans of the same subject. Column 3 shows the difference between the scans, and column 4 shows the difference between the 1st scan and that from a different subject. (b)–(c) Pairwise distance matrices between 33 binary networks extracted from the test-retest dataset. (d) Relationship between the threshold θbin and the dICC score.

