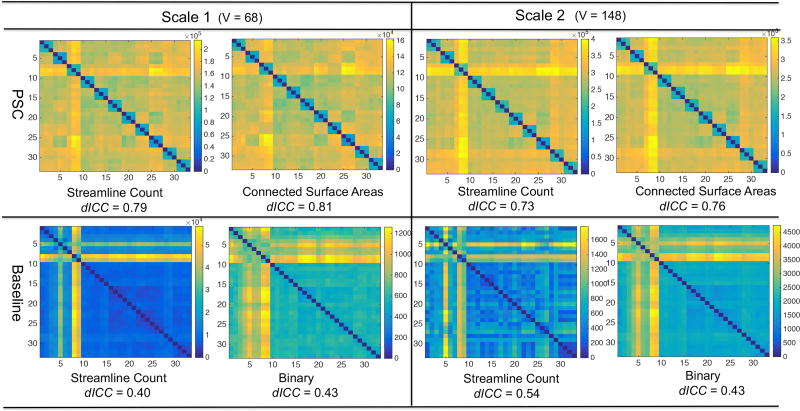
Figure 7.
Comparison of PSC with a routine procedure of extracting the connectivity matrices from tractography data. The test-retest dataset is used here. The top row shows the pairwise distance matrices of the streamline count and the CSA matrices produced by PSC. The bottom row shows pairwise distance matrices of the streamline count matrices and the binary network matrices produced by the routine procedure. To compare with the binary networks produced by PSC, readers can refer to Figure 6.

