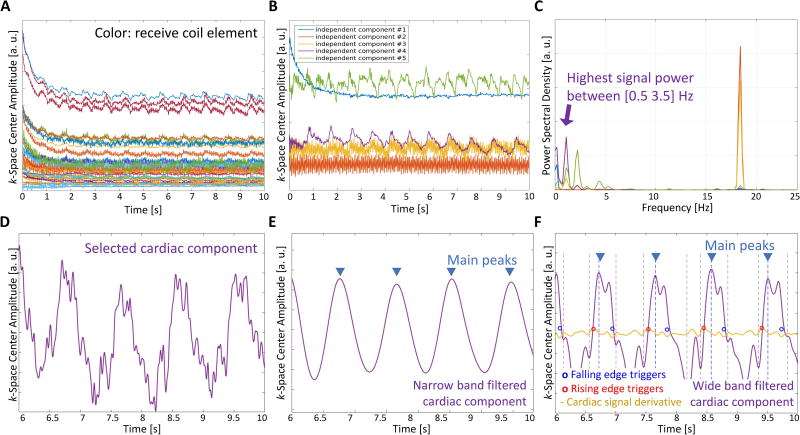
Figure 2.
Main steps of the self-gating method. The k-space center amplitude is recorded during the scan for all receive coils (A). Independent component analysis is applied to reduce the set of signals into fewer components (B). The component with highest spectral power in the cardiac frequency range is selected (C, D). The cardiac component is band-pass filtered with a narrow band to detect heartbeats (main peaks, E). The cardiac SG signal is obtained after pass-band filtering the signal in D with a wider band. Here high prominence peaks are found and cardiac triggers are identified on either the rising or falling edges of the detected high prominence peaks where the signal derivative is maximized or minimized–steepest point on the edge (yellow signal, F).

