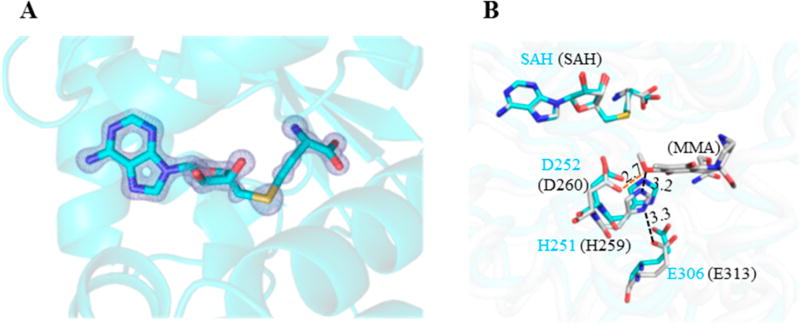
Figure 6.
Active site of the LaPhzM. (A) The 2Fo–Fc electron density map around the cofactor binding site. The map is illustrated in light blue color and contoured at 3σ. The cofactor product S-adenosyl-l-homocysteine (SAH) is represented by sticks. (B) The stick representation of the active site in LaPhzM (cyan carbon atoms) overlaid with the MmcR-SAH-mitomycin A (MMA) complex (PDB ID: 3GXO, gray carbon atoms). The residues in LaPhzM are labeled in cyan fonts, and the corresponding ones in MmcR are labeled in black fonts in the round bracket. The nitrogen atoms are in blue, oxygen in red, and sulfur in yellow.

