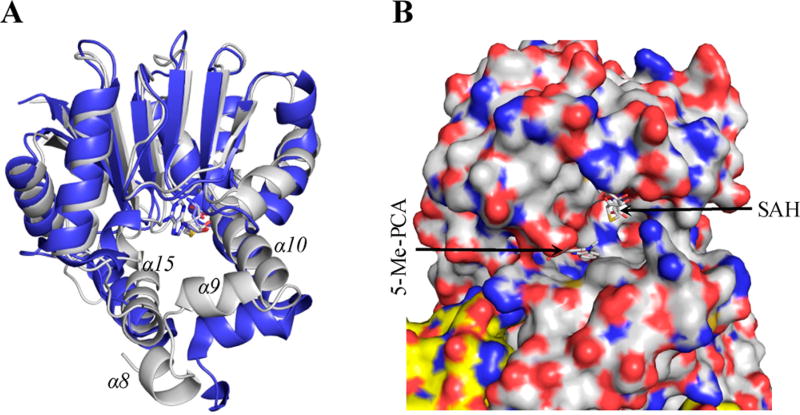
Figure 8.
Comparison of the substrate binding pocket of PhzM (PDB ID: 2IP2) and LaPhzM. (A) A ribbon presentation of PhzM (blue) overlaid with LaPhzM (light gray). Only the residues from AA121 to the end of the C terminus are included for clarity. (B) A surface presentation around the active site of PhzM viewed from the protein–solvent interface. The surface presentation is colored by the underlying atoms with nitrogen in blue and oxygen in red. The surface around carbon atoms is colored white for one monomer and yellow for the second monomer for clarity. SAH was modeled to the active site of PhzM guided by its homologue IOMT (PDB ID: 1FP2); 5-Me-PCA (N5-methylphenazine carboxylic acid) was manually placed near SAH for the purpose of demonstration.

