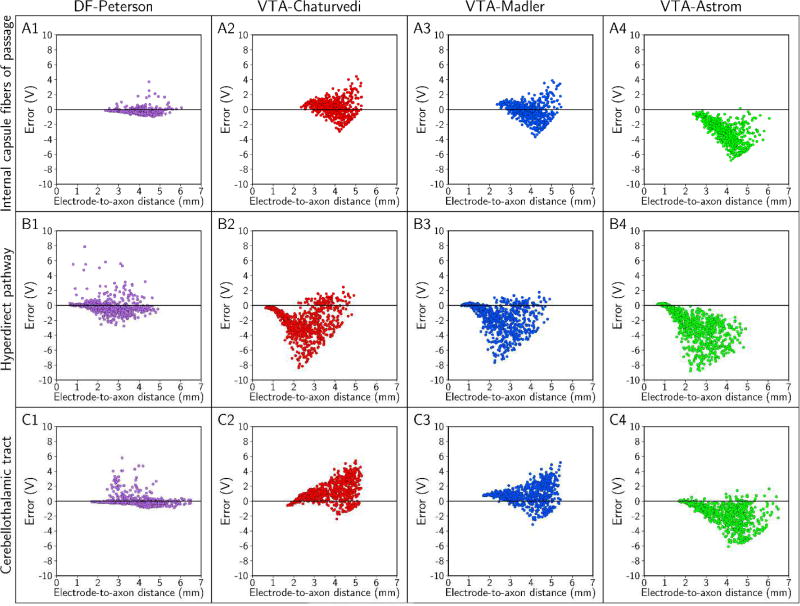
Figure 6.
Errors in the threshold stimulus amplitude as a function of the electrode-to-axon distance. Each column pertains to one predictor, and errors were calculated for the: (A) internal capsule fibers of passage, (B) hyperdirect pathway, and (C) cerebellothalamic tract. In this analysis, the stimulus pulse width was 90 µs; contact 2 was the cathode (−), the case was the anode (+), and the axon diameter was 5.7 µm.

