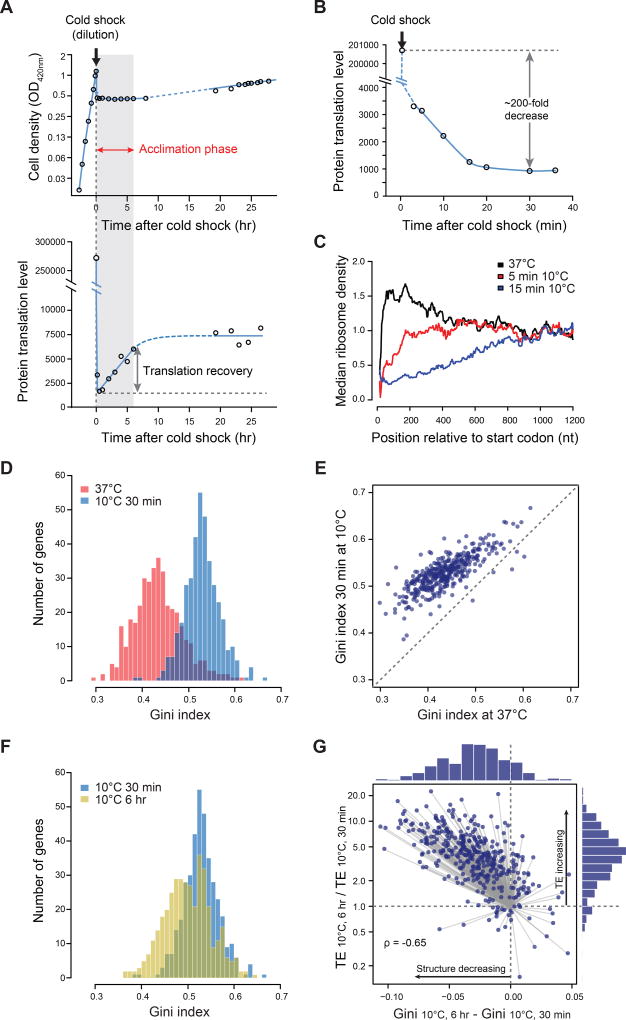
Figure 1. Global change in translation and mRNA structure during the acclimation phase following cold shock.
(A) Top: Cell growth after shift to 10°C. Cells gro wing exponentially at 37°C were shifted to 10°C (using dilution to achieve instantaneous tempe rature equilibration indicated by the arrow at t = 0; see Methods), and grown until exponential phase was restored (~25 hours after cold shock). Bottom: Protein synthesis after shift to 10°C. Cultures were simultaneously sampled for OD420 and protein synthesis (35S-methionine pulse labeling) at different timepoints (see Methods). Protein synthesis rate is calculated as: 35S-methionine incorporated / minute / OD420 / 100µL culture. The acclimation phase is shaded gray and marked by a red arrow.
(B) Detailed time course of protein synthesis immediately after shift to 10°C, measured as in (A).
(C) Meta-gene analysis of ribosome run-off after cold shock. At 5 min and 15 min after cold shock, the median of ribosome density at each position relative to the ORF start codon was calculated across well-expressed genes (N = 492) and normalized to the median ribosome density within the window between 1000 nt and 1180 nt downstream of start codon. Analysis is limited to ORFs ≥ 1200 nt long, and curves are smoothed by calculating the median within rolling windows of 25 nt (see Methods).
(D) Histogram of Gini indices of E. coli ORFs calculated from in vivo DMS-seq data at 37°C (red) or 30 min after cold shock (blue). Gini indices were calculated for 391 well-expressed genes with relatively constant mRNA across the ORF and a mean DMS-seq signal of ≥ 5 reads/nt in all samples (see Figure S1C-D for determination of read cut-off). P-value < 2.2-16, based on Kolmogorov-Smirnov (K-S) test.
(E) Scatter plot comparing Gini indices of individual ORFs at 37°C and 30 min after cold shock to 10°C.
(F) Histogram of Gini indices of the 391 ORFs described in (D) at 30 min (blue) or 6 hr (yellow) after cold shock in WT cells. P-value < 2.2-16, based on K-S test.
(G) Plot of the change in Gini indices vs translation efficiency (TE) between 30 min and 6 hr after cold shock. The distribution of changes in RNA structure level is shown in a histogram above the figure and that for TE changes is shown to right. Most genes fall in the upper left quadrant, indicating a decrease in RNA structure level concomitant with an increase in TE. The change of TE during acclimation phase is highly correlated with the change of mRNA structure (Spearman's rank correlation coefficient ρ = −0.65).

