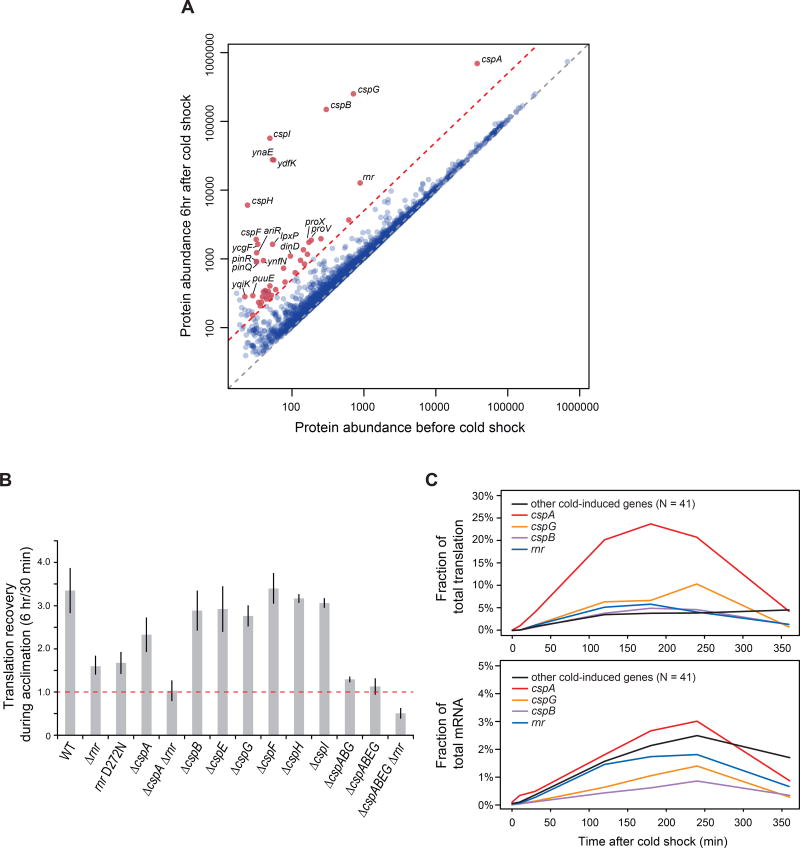
Figure 2. Key factors involved in the translation recovery circuit during acclimation phase.
(A) Scatter plot comparing ORF protein abundance at 37°C and at the end of acclimation (6 hr after cold shock). Grey dashed line: Y = X; red dashed line: 5-fold increase in protein abundance after acclimation relative to 37°C. Red p oints above the line are well expressed ORFs whose protein abundance increased ≥ 5-fold (N = 45), with the labeled ORFs increasing ≥ 10-fold (N = 20). See also Table S2.
(B) Deleting RNase R and the Csps inhibits translation recovery during acclimation. Bar graph indicates the ratio of cellular translation (measured by 35S-methionine pulse labeling) at 6 hr vs 30 min after cold shock for WT and mutant strains. Error bars: standard deviation across >2 replicates.
(C) Fraction of total protein translation (upper panel) and total mRNA amount (lower panel) for the 45 most highly induced genes at different time points after cold shock. See also Table S3.
See also Figure S2.

