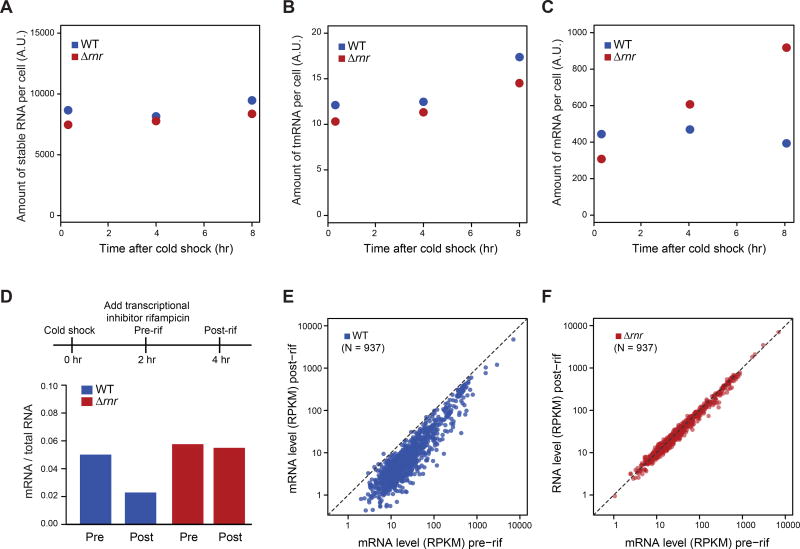
Figure 3. RNase R facilitates mRNA degradation during acclimation phase.
(A-C) RNA content of WT and Δrnr cells at 20 min, 4 hr and 8 hr after cold shock for: (A) stable RNA; (B) tmRNA; and (C) mRNA. RNA content was calculated from the fraction of RNA-seq reads mapping to different types of RNA, normalized to total RNA level measured by continuous labeling of 3H-uridine during 37°C growth and after cold shock (see Methods).
(D) mRNA content of WT and Δrnr cells before and after rifampicin (rif) treatment at 10°C. Upper: schematic of experiment. Lower: mRNA / total RNA before and after the 2 hr treatment with rifampicin, calculated from the fraction of RNA-seq reads mapping to mRNA.
(E-F) mRNA amount of individual genes (N = 937) in WT (E) or Δrnr cells (F) before and after rif treatment diagrammed in (D). mRNA level was quantified by number of RNA-seq Reads Per Kilobase of transcript per Million mapped reads (RPKM).

