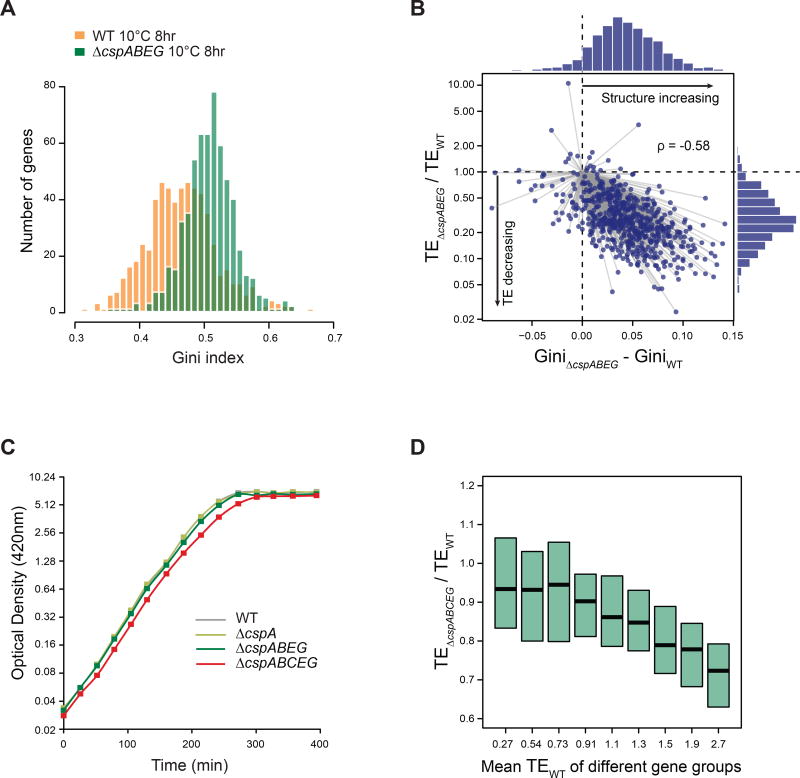
Figure 4. Csps are required for decreased mRNA structure during acclimation.
(A) Histogram of Gini indices of ORFs in WT (orange) or ΔcspABEG cells (green) at 8 hr after cold shock (N = 592). Gini indices were calculated from the in vivo DMS-seq data. P-value < 2.2-16, based on K-S test.
(B) Plot of the difference in Gini indices vs the difference in translation efficiency (TE) between WT and ΔcspABEG cells at 8 hr after cold shock. Histograms of the differences in RNA structure level (above) and of TE differences (right) are shown. Most genes fall in the lower right quadrant, indicating that ΔcspABEG cells have higher mRNA structure level and lower TE than WT cells. The difference of TE between WT and ΔcspABEG cells is highly correlated with the difference of their mRNA structure level (Spearman's rank correlation coefficient ρ = −0.58).
(C) Growth curves (OD420) of WT, ΔcspA, ΔcspABEG and ΔcspABCEG cells at 37°C in MOPS rich defined media minus methionine on a log scale. Doubling times: WT 27.6 ± 0.2 min; ΔcspA 27.6 ± 0.3 min; ΔcspABEG 28.4 ± 0.2 min; ΔcspABCEG 29.8 ± 0.2 min, showing mean ± SD based on 3 replicates.
(D) Distribution of the change in TE in ΔcspABCEG cells compared to WT cells at 37°C. Genes were binned into 9 groups based on their TEs in WT cells, with mean TE of each group indicated on the X-axis. The distribution of changes in TE in ΔcspABCEG vs WT cells was then calculated for each group of ORFs, with the box center indicating the median, and the box length indicating the 25th ~ 75th percentile of TE change.
See also Table S6.

