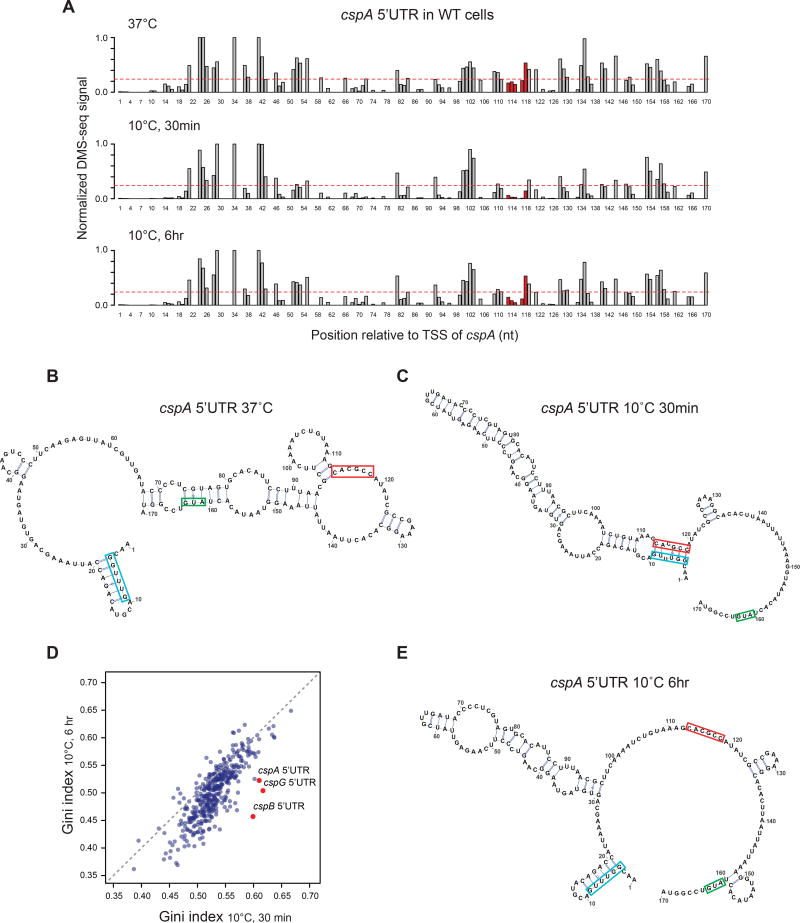
Figure 5. The 5’UTR of cspA changes in mRNA structure during acclimation.
(A) The normalized in vivo DMS-seq signal of A/C bases within cspA 5’UTR in WT cells at 37°C (top), 30 min (middle) or 6 hr (bottom) after cold shock. DMS-seq signals were normalized to the maximum signal within cspA message after removing outliers by 98% Winsorisation (see Methods). The red dashed line represents the signal cutoff (0.24), above which the A/C bases are predicted to be unpaired. The region highlighted in red has long-range interactions with the “cold box” element at 10°C.
(B-C) The predicted structure of the cspA 5’ UTR at (B) 37°C or (C) 30 min after cold shock. Structure predictions were generated by constraining a minimum free-energy prediction with in vivo DMS-seq data. The start codon of cspA (green), the conserved “cold box” element (blue) and its long-range interaction region at 10°C (red) are highlighted.
(D) Scatter plot comparing Gini indices of ORFs (N = 391) and 5’UTR of cspA, cspB, cspG (red dots) at 30 min vs 6 hr after cold shock. Grey dashed line: Y = X.
(E) The predicted structure of the cspA 5’ UTR at 6 hr after cold shock, as shown in (B-C). See also Figures S4, S5 and S6.

