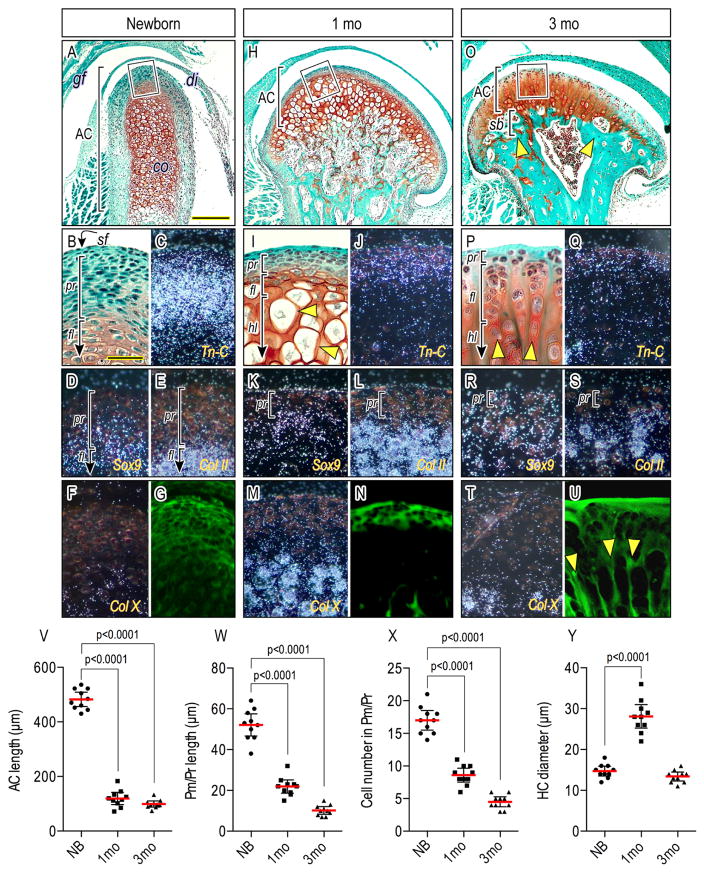
Figure 1.
Condylar articular cartilage development, zonal organization, cellularity and matrix configuration over age. Mid-frontal portions of TMJs from newborn (A–G), 1-month (H–N) and 3-month (O–U)-old wild-type mice were analyzed by Safranin-O/fast-green staining (A, B, H, I, O, P), in situ hybridization (C–F, J–M, Q–T), and a confocal microspopy-detectable cartilage matrix (G, N, U). Boxed-area of condylar apical end (A, H, O) was magnified in (B, I, P). Brackets demarcate polymorphic/progenitor layer (pr), flattened chondrocyte layer (fl), hypertrophic chondrocyte layer (hl) and subchondral bone plate (sb). In situ hybridization with isotope-labeled riboprobes for Tn-C (C, J, Q), Sox9 (D, K, R), Col II (E, L, S) and Col X (F, M, T) expression. (V): Articular cartilage (AC) length, (W): polymorphic/progenitor (Pm/Pr) length, (X): cell number in Pm/Pr, and (Y) hypertrophic chondrocyte diameter of distinct TMJs from wild-type mice at age of newborn, 1 month and 3 months were analyzed. Areas were selected from 3–5 mid-frontal sections per sample and 10 TMJs were analyzed (n=10/each group, p values are indicated in the scatter plots). The dots represent the mean data of 10 TMJ samples (n=10). The long red horizontal bar represents the mean value and the short horizontal bars represent 95% confidence intervals. Scale bars: 90 μm in A for A, H, O; 25 μm in B for B–G, I–N, P–U. gf, glenoid fossa; dc, disc; cd, condyle, lp, lateral pterygoid muscle, AC, articular cartilage, sf, superficial layer; pr, polymorphic/progenitor layer; fl, flattened chondrocyte layer; hl, hypertrophic layer; sb, subchondral bone plate.

