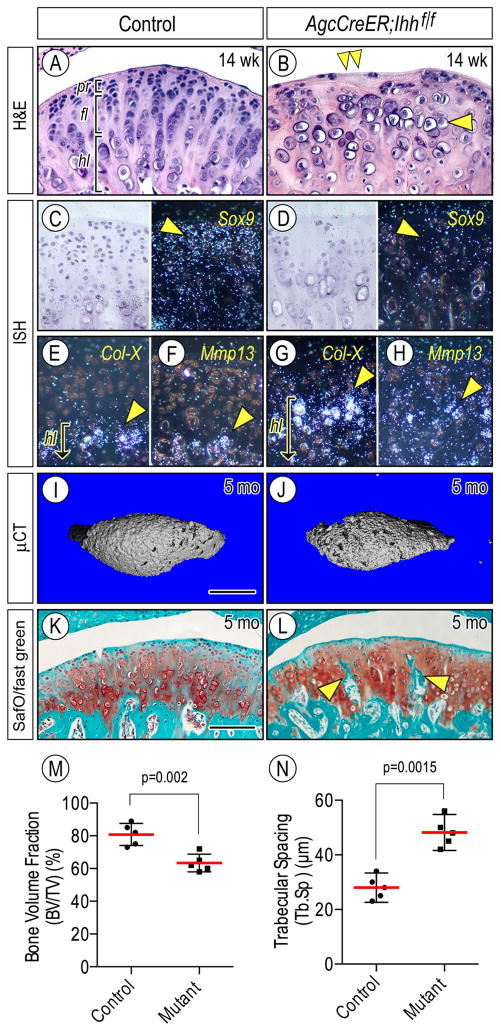
Figure 5.
Defective condylar articular cartilage and subchondral bone in Agr-CreER; Ihh f/f mice over time. TMJs from 14-week (A–H) and 5-month (K–L) of control (A, C, E, F, I, K) and Agr-CreER;Ihh f/f (B, D, G, H, J, L) mice were analyzed by hematoxylin and eosin staining (A, B), in situ hybridization (C–H), μCT (I, J), and Safranin-O/fast green staining (K, L). In situ hybridization with isotope-labeled riboprobes for Tn-C (C, D), Col-X (E, G), and Mmp13 (F, H) expression. Note that Col-X/Mmp13-expressing hypertrophic chondrocytes in mutant condyles reside closer to the condylar surface compared to controls (E–H, arrowhead, respectively). Quantification of bone volume fraction (TB/TV) (M) and travecular spacing (Tb.Sp) (N) of condylar subchondral bone plate by μCT. Five TMJs/group were analyzed (n=5/group, p values are indicated in the scatter plots) and data plots, average and 95% confidence intervals are presented. Scale bars: 75 μm in A for A–H; 220 μm in I for I–J; 125 μm in K for K–L. pr, polymorphic/progenitor layer; fl, flattened chondrocyte layer; hl, hypertrophic chondrocyte layer.

