
Figure 2. RIM1 C2B domains are dispensable for the functions of RIM in Munc13 recruitment, vesicle priming and Ca2+ influx.
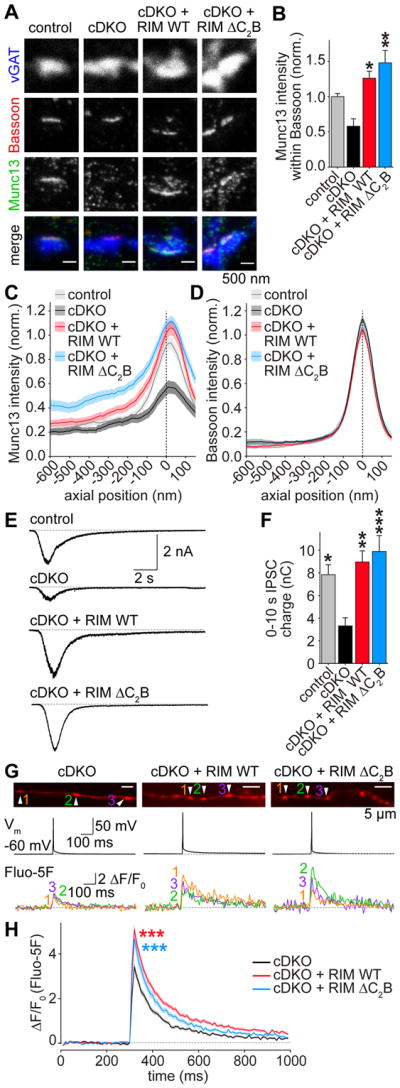
(A, B) Example images (A) and average Munc13 intensity (B) of synapses in STED microscopy. Control n = 3 independent cultures/7 fields of view, cDKO 3/6, cDKO + RIM WT 3/6, cDKO + RIM ΔC2B 3/6.
(C, D) Intensity profile for Munc13 (C) and Bassoon (D) in side view synapses. Control n = 3 independent cultures/60 ROIs, cDKO 3/53, cDKO + RIM WT 3/64, cDKO + RIM ΔC2B 3/66.
(E, F) Example traces (E) and quantification of IPSC charge (F) integrated over 10 s, induced by a focal 10 s puff of hyperosmolar sucrose (500 mM) as a measurement of the RRP. Control n = 3 independent cultures/13 cells, cDKO 3/15, cDKO + RIM WT 3/13, cDKO + RIM ΔC2B 3/13.
(G, H) Example boutons (G) and quantification (H) of presynaptic Ca2+ imaging. Individual cells were filled with Alexa 647 and the Ca2+ indicator Fluo-5F through a patch pipette. In G, images of Alexa 647 fluorescence in axons (top), the somatic membrane potentials (middle) and Fluo-5F fluorescence traces of individual boutons during a single action potential (bottom) in response to a brief somatic current injection are shown. Arrowheads in Alexa 647 images indicate boutons from which Fluo-5F signals at the bottom were obtained. H shows the average Fluo-5F ΔF/F0 during a single action potential. cDKO n = 3 independent cultures/8 cells/153 boutons, cDKO + RIM WT 3/8/160, cDKO + RIM ΔC2B 3/8/93. *** p < 0.001 genotype vs cDKO by 2-way ANOVA, for first 6 frames after stimulation.
All data are mean ± SEM, *p < 0.05, ** p < 0.01, *** p < 0.001 vs cDKO analyzed by one-way ANOVA (Kruskal Wallis; B,F) unless otherwise noted, all comparisons to cDKO. For overview STED images and quantification of Bassoon signals, see Figures S2B–S2D.