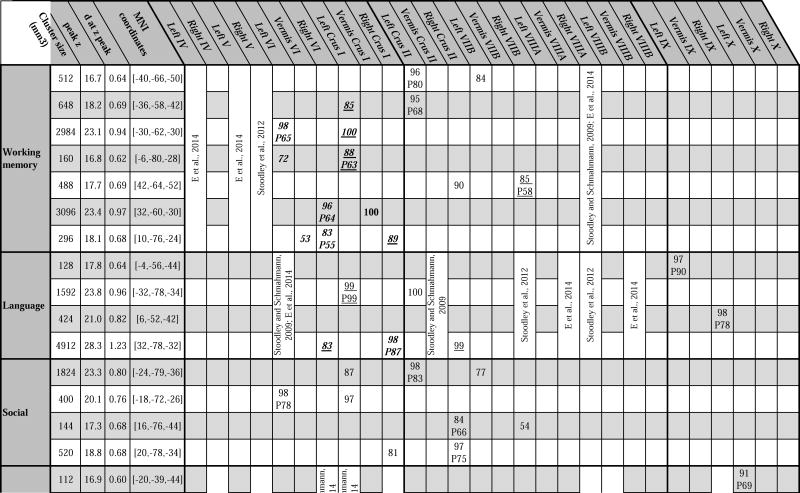
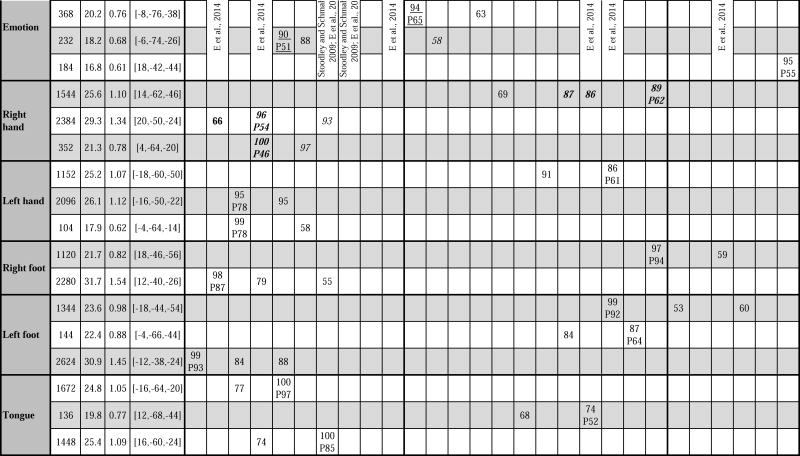
Table 1.
Detailed description of clusters of activation. Key: MNI coordinates = x, y, z coordinates of cluster z peak. Presence of a number written under lobule locations indicates cluster location according to Diedrichsen et al’s FNIRT MNI maximum probability map (Diedrichsen et al., 2009), and value of the number indicates maximum % probability reached at that lobule in the FNIRT MNI probability map. P = z peak location followed by % probability of peak location are also according to the FNIRT MNI maximum probability map (Diedrichsen et al., 2009). Cluster location is written in bold if previously described in Stoodley et al., 2012 (group study, n=9), in italics if previously described in Stoodley and Schmahmann, 2009 (meta-analysis), underlined if previously described in Keren-Happuch et al., 2014 (meta-analysis), or in regular style if not previously described in any of those three studies.


