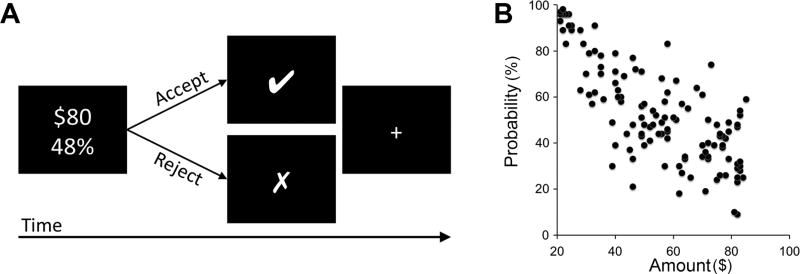
Figure 1.
Risk tolerance task. (A) A depiction of one trial of the task. Participants chose between a smaller certain reward (100% change of $20) and a larger riskier reward (e.g., 48% chance of $80) for each of 120 trials. The smaller-certain reward was fixed at 100% chance of $20 and the larger-risky reward was varied from trial to trial. Each trial began with the presentation of the risky option; the standard certain option was not displayed to simplify the display. When subjects made their choice, a marker indicating that choice (“□” if the risky option was chosen, “□” if the certain option was chosen) appeared for 1 s. Subjects had 4 s to make their choice. (B) Risky options used in the task. Each point represents the risky option offered on a single trial. The x-axis indicates the reward amount ($) and the y-axis indicates the reward probability (%).

