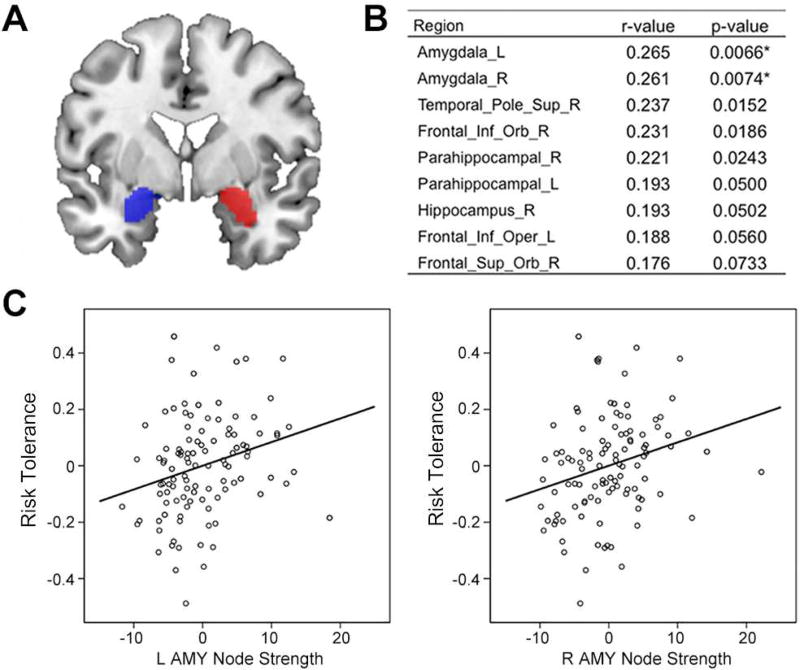
Figure 2.
Significant correlations between risk tolerance and node strengths of resting-state network. (A) Amygdala seeds (blue for left hemisphere; red for right hemisphere) identified by AAL template. (B) Brain regions with the highest correlation coefficients (top 10%) between risk tolerance and node strength, calculated using graph theoretical analysis of resting-state fMRI. (C) Partial correlation scatterplot between risk tolerance and left (right) amygdala node strength. For illustration purposes, this scatterplot was generated by performing Pearson correlation analysis between residuals after regressing out age, sex, IQ, and mean FD. L, left; R, right; Sup, superior; Inf, inferior; Orb, orbito; Oper, opercular; AMY, amygdala.

