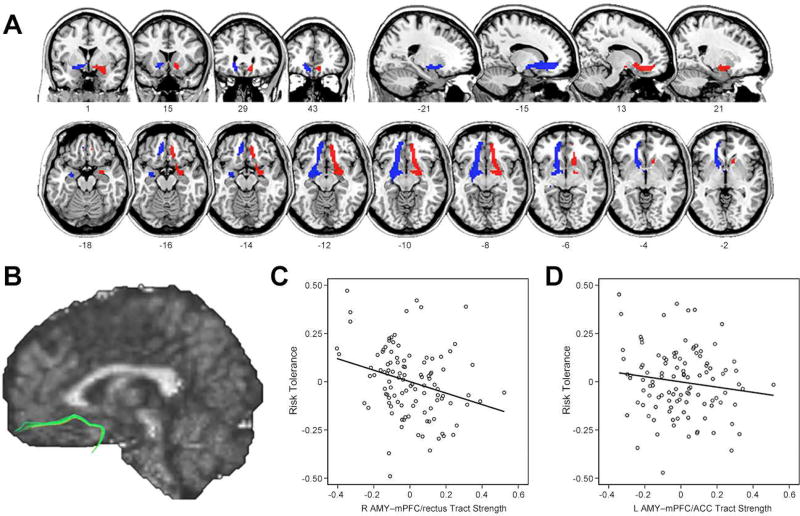
Figure 4.
Results from structural connectivity analyses. (A) Group probability maps of amygdala to mPFC white matter tracts (blue for left hemisphere; red for right hemisphere) are illustrated in coronal, sagittal, and axial views. For illustration purposes, individual subject’s probabilistic tractography results were transformed into standard space, binarized, and summed across all subjects. Finally, the summed tract images were thresholded to show only overlapping pathways in at least 54 of 108 participants. (B) A single subject map of amygdala to mPFC tract identified using deterministic tractography (for illustration purposes only). (C) Partial correlation scatterplot between risk tolerance and tract strength from right amygdala to mPFC/rectus. (D) Partial correlation scatterplot between risk tolerance and tract strength from left amygdala to mPFC/ACC. For illustration purposes, Figure 4C and 4D were generated by performing Pearson correlation analysis between residuals after regressing out age, sex, and IQ.

