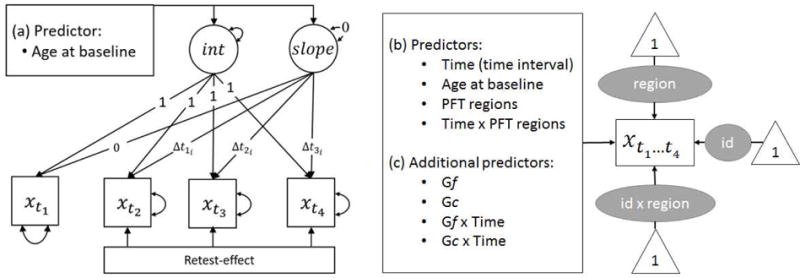
Figure 1.

Three statistical models of change in cortical thickness, volume, and cognitive measures (Gf and Gc). (a) Latent growth curve model of Gf and Gc (denoted as x) across four measurement occasions., with age at baseline as cross-sectional predictor. (b) Crossed-random effects model for the analysis of cortical thickness and volume (denoted as ) with three random effects for brain region (region), person (id), and their interaction (id × region). Time, age at baseline, PFT regions membership, and the Time × PFT regions interaction were included as predictors. (c) To link cognitive and cortical measures, model (b) was augmented by the additional variables: Gf, Gc, Gf × Time, Gc × Time. The variable Time denotes the time intervals Δti in age from the first measurement occasion, for everyone.
