
Figure 3.
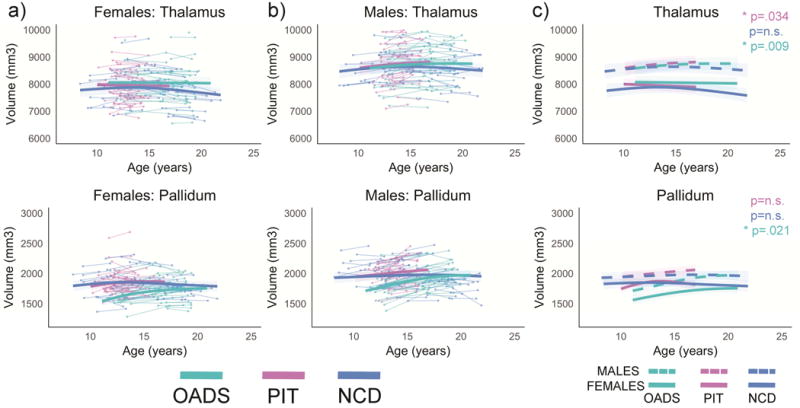
Developmental age trajectories for the thalamus and pallidum. a) Females and b) males are plotted separately. Individual datapoints are shown, connected for each participant, in the appropriate sample color. The bolded colored lines represent the GAMM fitting for each sample with 95% confidence intervals. c) Representation of GAMM fits (with 95% confidence intervals) for each sex per sample plotted together, p-values represent sex differences per sample.