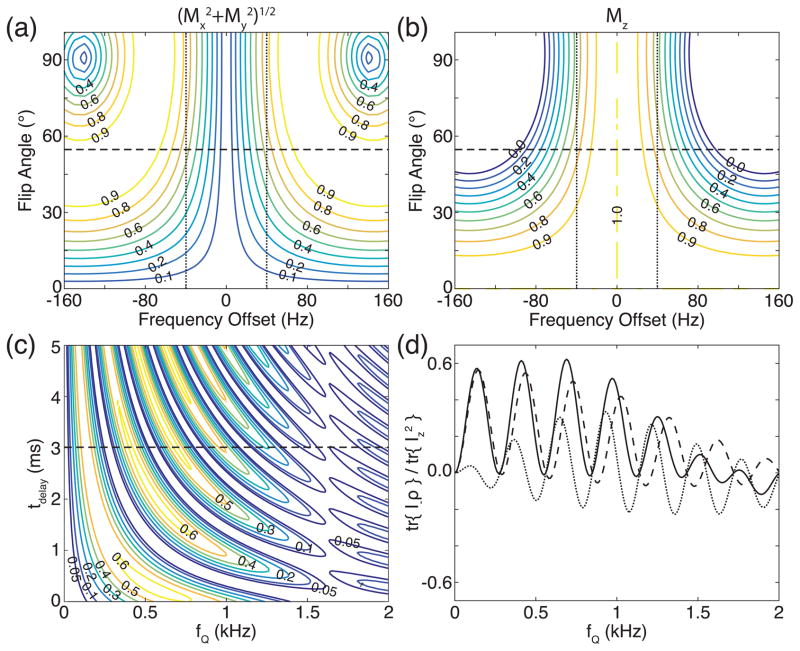
Figure 5.
Numerically simulated performance of the QJR sequence. (a, b) The normalized magnitude of the (a) transverse and (b) longitudinal components of the magnetization vector at the end of the jump-and-return sequence with tdelay equal to 3 ms is plotted as a contour map against the flip angle of the pulses and the frequency offset. No residual quadrupolar couplings are assumed. The horizontal dashed line indicates when the flip angle of the pulses is the magic angle, and the vertical dotted line the frequency offset of ±40 Hz. (c) The absolute value of the normalized signal intensity is plotted against fQ and tdelay. The horizontal dashed line indicates when tdelay is 3 ms. (d) The real parts of the signal intensities are plotted against fQ. The contributions of the central and satellite peaks are represented by dashed and dotted lines, respectively.

