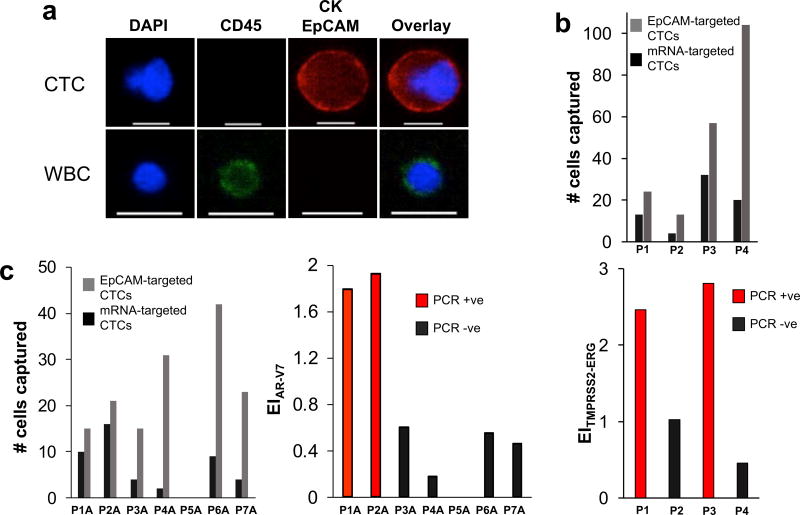
Figure 4. Analysis of clinical samples.
(A) Representative image of a CTC captured from a prostate cancer patient blood sample versus a white blood cell (WBC). The cells were stained with APC-labeled anti-CK, APC-labeled anti-EpCAM, AF488-labeled anti-CD45, and DAPI. Only CK+/EpCAM+/CD45−/DAPI+ cells are counted as CTC. The scale bar is 15 µm. (B) Analysis of blood samples collected from prostate cancer patients for the TMPRSS2-ERG gene fusion. Samples that tested positive for the gene fusion (see Supplementary Figure 11) exhibited significantly higher expression indices than those that tested negative. (C) Analysis of blood samples collected from prostate cancer patients for the androgen receptor splice variant AR-V7. Samples that tested positive for AR-V7 (see Supplementary Figure 12) exhibited significantly higher expression indices than those that tested negative.

