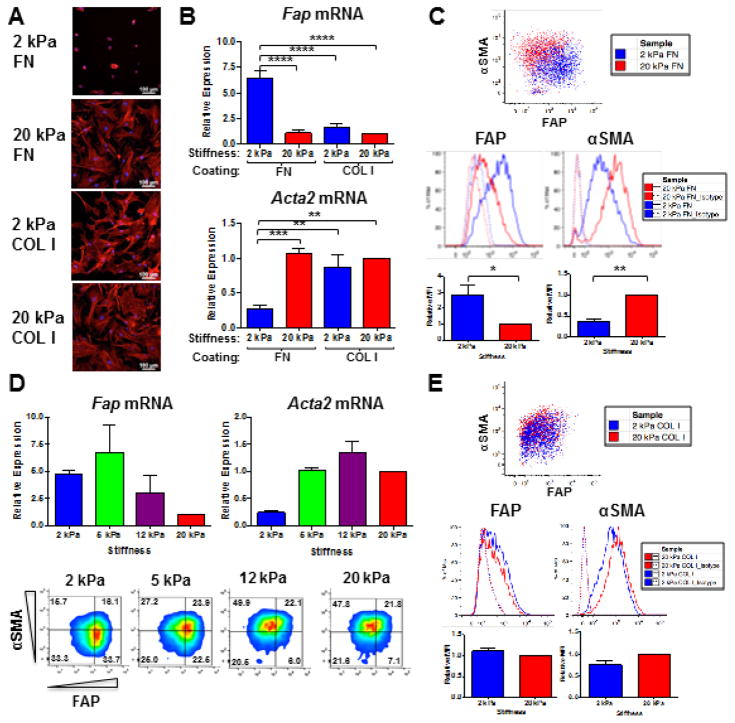
Figure 2. ECM composition and elasticity govern activated fibroblast phenotypic heterogeneity.
Representative phalloidin staining of the actin cytoskeleton (A) and Fap and Acta2 gene expression (B) in fibroblasts cultured in 10% serum on 2 versus 20 kPa FN- or COL I-coated hydrogels for 72 hours. Data were compiled from 4 independent experiments and bar graphs depict the mean +/− SEM. (C) Representative flow cytometric analysis, including quantification of relative median fluorescent intensities (MFI) for FAP and αSMA expression in fibroblasts cultured in 10% serum on 2 kPa (blue) versus 20 kPa (red) FN-coated hydrogels for 72 hours. Data were compiled from 3 independent experiments and bar graphs depict the mean +/− SEM. (D) QRT-PCR (top) and flow cytometric analysis (bottom) of FAP and αSMA expression in fibroblasts cultured in 10% serum on 2, 5, 12, and 20 kPa FN-coated hydrogels for 72 hours. Data were compiled from 2 independent experiments and bar graphs depict the mean +/− SEM. (E) Representative flow cytometric analysis, including quantification of relative MFI for FAP and αSMA expression in lung fibroblasts cultured in 10% serum on 2 kPa (blue) versus 20 kPa (red) COL I-coated hydrogels for 72 hours. Data were compiled from 3 independent experiments and bar graphs depict the mean +/− SEM.

