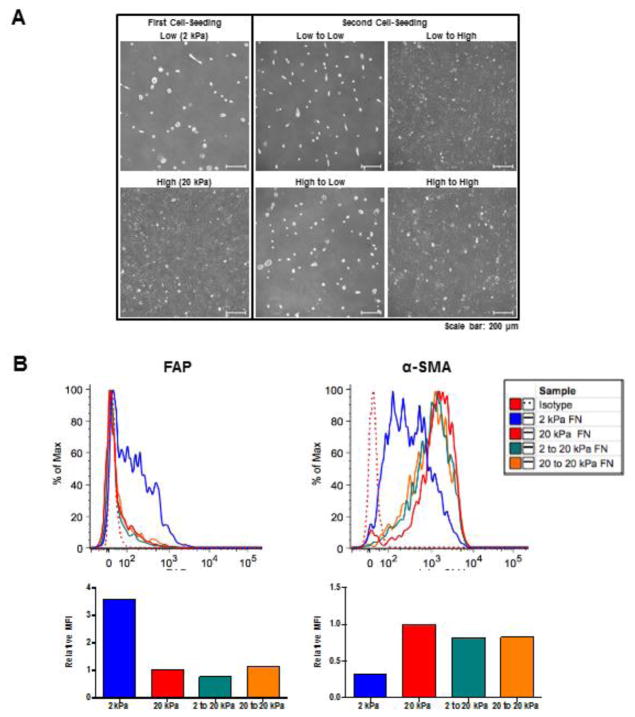
Figure 3. FAPHi and αSMAHi fibroblasts exhibit morphologic and phenotypic plasticity.
Fibroblasts were serially cultured (in 10% FCS DMEM) first on either 2 or 20 kPa FN-coated hydrogels for 72 hours, and then cells recovered by trypsinization from each of these groups were cultured for a second time on either 2 or 20 kPa FN-coated hydrogels for an additional 72 hours. At both rounds 1 and 2, cell monolayers were analyzed by phase contrast microscopy and cell suspensions were analyzed by flow cytometry. Representative phase contrast images (A) and flow cytometric analysis (B), including quantification of relative MFI for FAP and αSMA expression, are shown.

