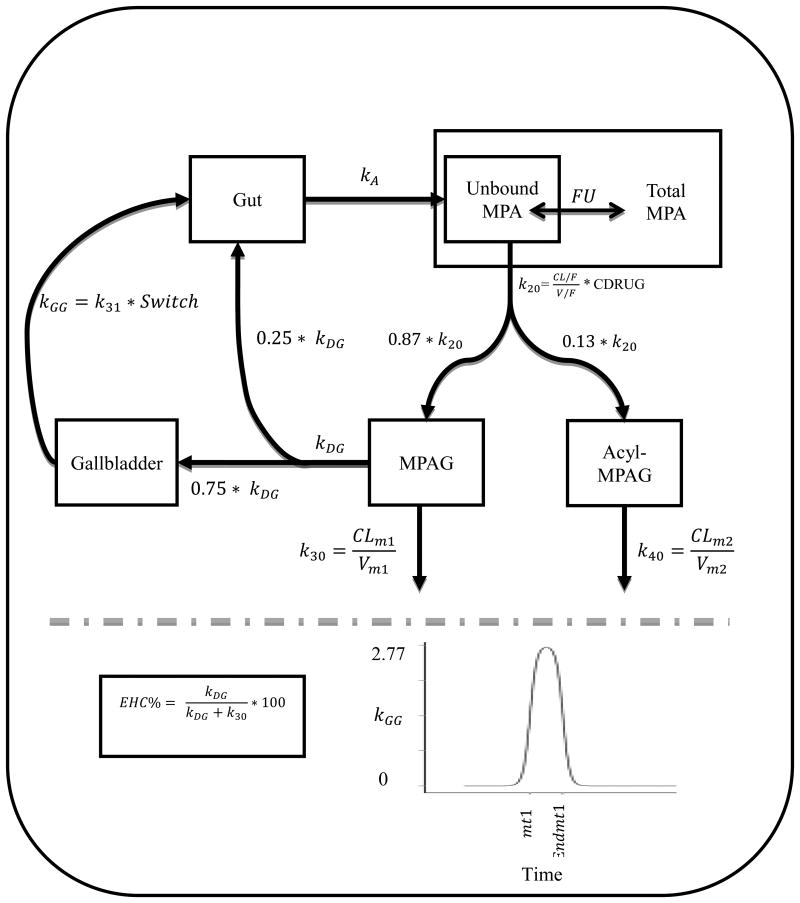
Figure 3.
Schematic Representation of the Model for unbound MPA, total MPA, MPAG and acyl-MPAG. kA : absorption rate constant; FU: fraction unbound; CL/F: apparent oral clearance of unbound MPA; V/F: apparent volume of distribution of unbound MPA; K20: unbound MPA elimination rate constant; CDRUG: concomitant CNI treatment; kDG: EHC distribution rate constant; kGG: gallbladder emptying rate constant; CLm1:MPAG oral clearance; Vm1:MPAG volume of distribution; k30: MPAG elimination rate constant; CLm2: Acyl-MPAG oral clearance; Vm2: Acyl-MPAG volume of distribution; k40: Acyl-MPAG elimination rate constant; mt1: represents a mealtime (beginning of gallbladder emptying); Endmt1: represents the end of gallbladder emptying. K31: gallbladder emptying rate constant that result in emptying around 75% of gallbladder content and its fixed to 2.77 hr-1. The definition of switch is provided in the text.

