
Figure 3.
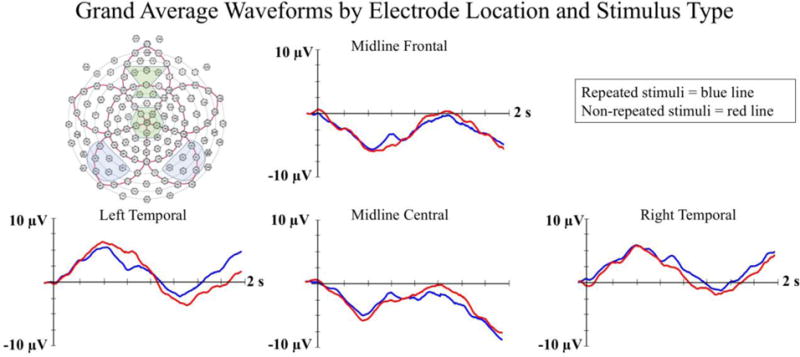
The grand average ERP waveforms by stimulus type and electrode location. Change in amplitude of the ERP relative to the prestimulus baseline is represented on the Y-axis (in microvolts), and time following stimulus onset is represented on the X-axis. The electrodes included in each electrode cluster used in the analyses are indicated in shaded boxes in the GSN Sensor Net montage shown in the upper left.