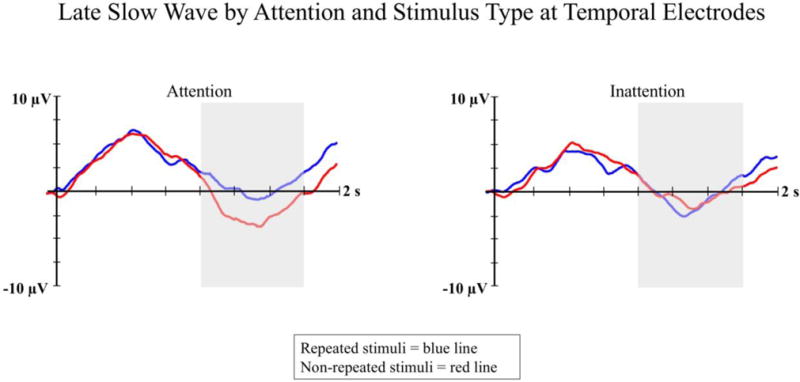
Figure 6.

LSW ERP amplitude is presented by attention and stimulus type at temporal electrodes. The averaged ERP waveform from attentive trials is shown in the left panel, and the averaged ERP waveform from inattentive trials is shown in the right panel. Blue lines represent responses to the repeated stimuli and the red lines represent responses to non-repeated stimuli. The shaded areas on the waveform plots indicate the time-window for the LSW analysis (i.e., 1000 – 1750 ms).
