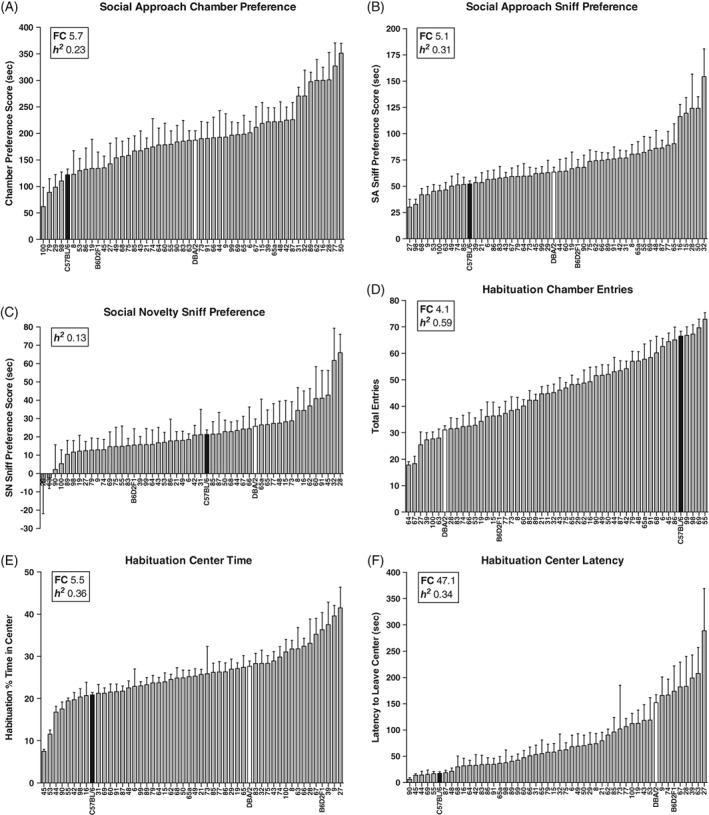
Figure 1.

Behavioral heterogeneity in the 3‐chamber social interaction task. The BXD panel shows continuous variation in (A), social approach chamber preference, (B), social approach sniff preference and (C) social novelty sniff preference. During habituation to the 3‐chamber, the BXD panel shows continuous variation in (D), chamber entries, (E), the percentage of time spent in the center chamber and (F), the latency to leave the center chamber. Data are means ± SEM. Parental strains are shown in black (C57BL/6) and white (DBA/2). The F1 cross (B6D2F1) and 47 BXD strains are shown in gray. The inset in each graph shows the estimated heritability (h 2) and fold‐change (FC) for each measure
