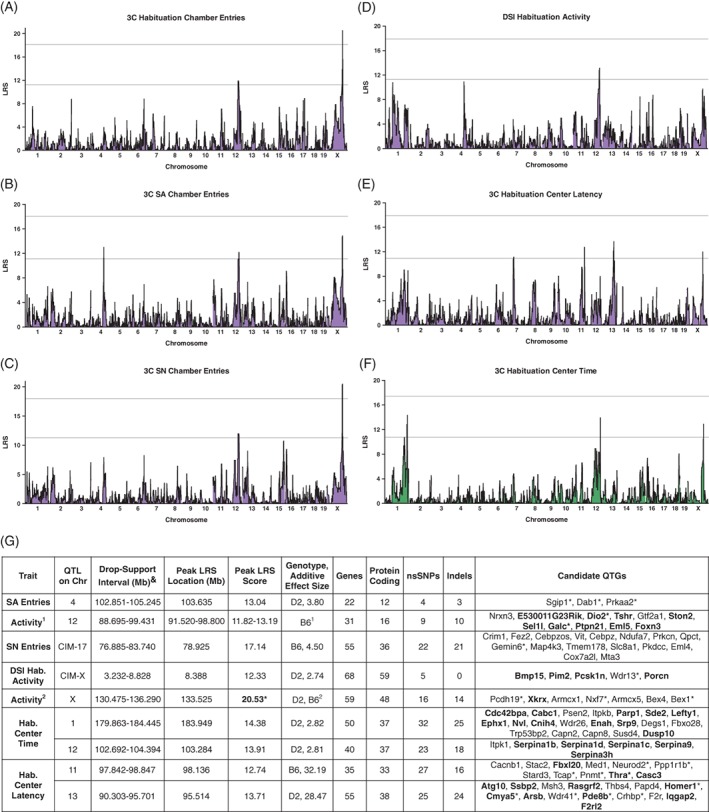
Figure 4.

Genome‐wide mapping to identify quantitative trait loci (QTLs) for nonsocial behaviors measured in the direct (DSI) and 3‐chamber (3C) social interaction tasks. (A‐C) Chamber entries during each session of the 3C task are associated with consistent QTLs on Chr 12 and X. The QTL on Chr X is significant (upper line) for entries made during (A), habituation and (C), social novelty (SN) sessions and suggestive (lower line) for (B), social approach (SA) entries. SA entries are also associated with a suggestive QTL on Chr 4. (D), Activity during habituation to the DSI chamber is associated with a suggestive locus on Chr 12 at the same location as in (A‐C). During habituation to the 3‐chamber, (E), latency to leave the center is associated with suggestive loci on Chr 11, 13 and X and (F), time spent in the center is associated with suggestive loci on Chr 1, distal 12 and X. Mapping color corresponds to the color of the primary factor containing each trait that was identified using PCA in Table 2. (G), Summary of QTL locations, peak LRS scores and locations, additive effect sizes and genotypes, gene numbers and number of genes with sequence variants, and candidate quantitative trait genes (QTGs). Candidate QTGs are listed in order of location on each on each Chr and were selected based on evidence of (1) QTLMiner ratings based on gene expression in brain, cis‐regulation and presence of nonsynonymous SNPs or Indels, (2) significant correlation between trait means and transcript expression in the hippocampus, hypothalamus or amygdala (P < .01, expression datasets in GN, bolded) or (3) involvement in human neurological disorders or key phenotypes related to activity or anxiety‐like behavior (starred). CIM controlling for the peak on Chr X for SN entries revealed an additional suggestive locus on Chr 17 (CIM‐17); controlling for the peak on Chr 12 for DSI activity revealed an additional suggestive locus on Chr X (CIM‐X, data shown in Figure S5). 3C, 3‐chamber social interaction task; Chr, chromosome; CIM, composite interval mapping; DSI, direct social interaction task; Hab., habituation session; Indels, insertions/deletions; LRS, likelihood ratio statistic; nsSNPs, nonsynonymous single nucleotide polymorphisms; SA, social approach session; SN, social novelty session; QTGs, quantitative trait genes. (1) Putative activity locus on Chr 12 is present for 3C entries during habituation (additive effect size, 6.11), SA (3.76) and SN (4.48) sessions and DSI activity (2.71). Listed are the combined drop support intervals, peak LRS scores and locations and candidate QTGs. (2) Putative activity locus on Chr X is present for 3C entries during habituation (additive effect size, 7.85; genotype, D2), SA (4.09, D2) and SN (5.74, D2) entries and 3C center time (2.77, B6) and center latency (27.54, B6). Listed are the combined drop support intervals, peak LRS scores and locations and candidate QTGs. Significant LRS scores are bolded and starred. &Drop‐support intervals were 0.5‐LOD for loci with LOD scores below 3.0 and 1.0‐LOD for loci with LOD scores above 3.0. CIM loci were required to have LOD scores of 2.50 or greater to be listed
