
Figure 5.
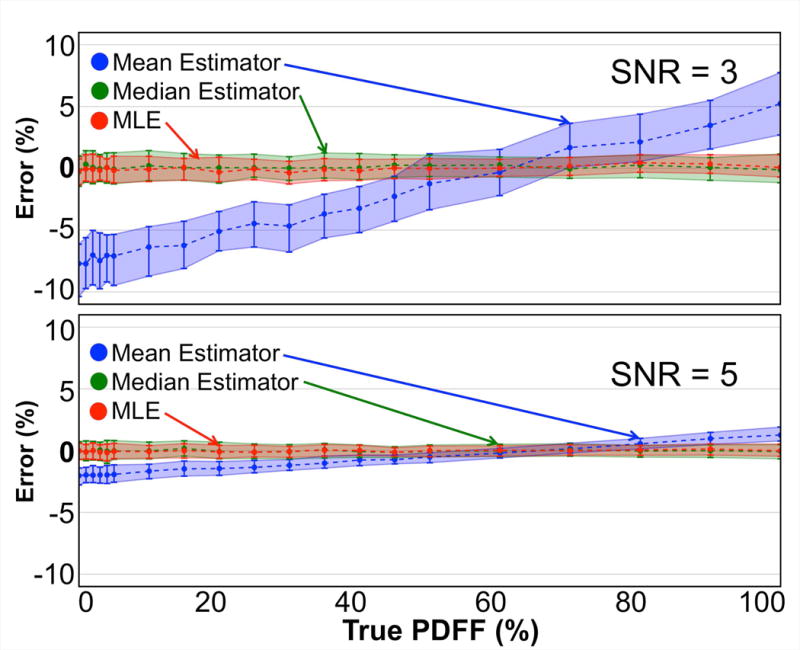
In simulation, the mean of an ROI in a PDFF map tends to underestimate low PDFF values and overestimate high PDFF values. In contrast, note the apparent unbiased quality of both the median and MLE in determining an estimate of the true PDFF. Each point represents a statistical analysis (median, 25th and 75th percentiles) of the PDFF estimation error of the three estimators on 200 noisy realizations of a simulated ROI. Signed absolute errors are plotted.